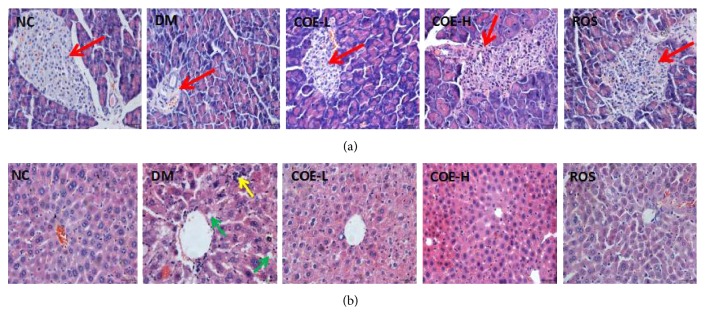
Figure 4.
Hematoxylin-eosin staining of the pancreas (a) and liver (b) in each group. Mice were supplemented with COE at 50 (COE-L) or 200 (COE-H) mg/kg body weight and rosiglitazone at 4 mg/kg body weight (ROS) for 4 weeks. Where, the red arrow pointed was pancreas islet, the green arrow pointed was fat droplet, and the yellow arrow pointed was inflammatory cells. The black English word on each picture represented the pictures' corresponding group.

