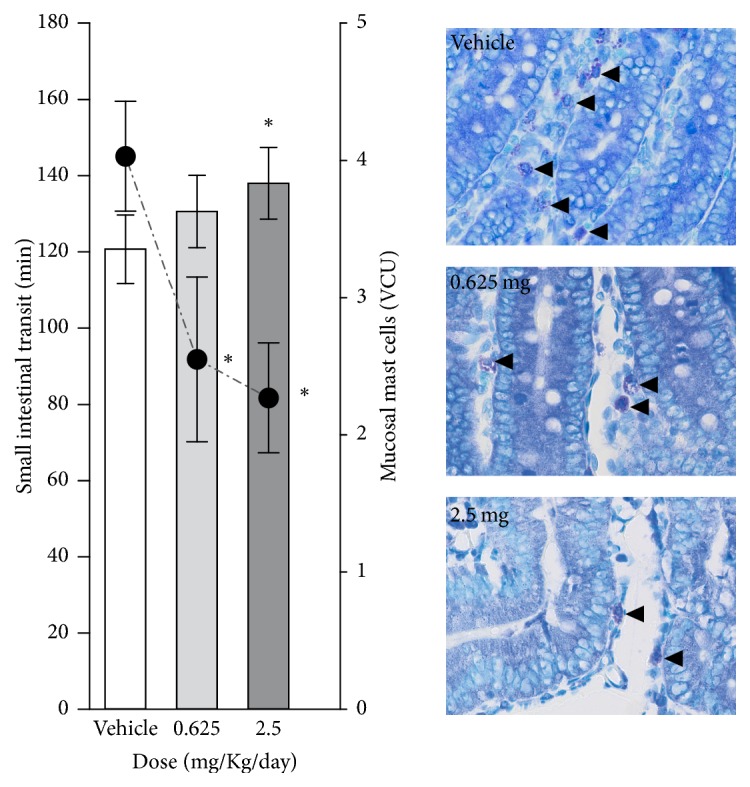
Figure 2.

Small intestinal transit, mucosal mast cell, and correlation between them were determined for all groups. Arrows indicate mucosal mast cell in the histological examples. For comparison between groups: ∗p < 0.05 versus vehicle.

Small intestinal transit, mucosal mast cell, and correlation between them were determined for all groups. Arrows indicate mucosal mast cell in the histological examples. For comparison between groups: ∗p < 0.05 versus vehicle.