
Fig. 6.
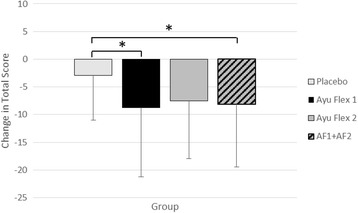
Mean ± SD changes in Total mWOMAC scores. Significant differences were noted between the AF1 group (p = 0.047) and when the two Active Groups (p = 0.042) were combined vs. the Placebo group
Official websites use .gov
A
.gov website belongs to an official
government organization in the United States.
Secure .gov websites use HTTPS
A lock (
) or https:// means you've safely
connected to the .gov website. Share sensitive
information only on official, secure websites.
Mean ± SD changes in Total mWOMAC scores. Significant differences were noted between the AF1 group (p = 0.047) and when the two Active Groups (p = 0.042) were combined vs. the Placebo group