Fig. 2.

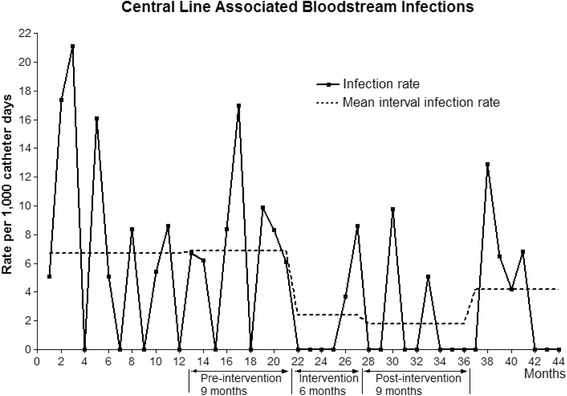
The trend of the central line-associated bloodstream infection (CLABSI) rate during the study periods. The broken lines indicate the mean CLABSI rate during each period

The trend of the central line-associated bloodstream infection (CLABSI) rate during the study periods. The broken lines indicate the mean CLABSI rate during each period