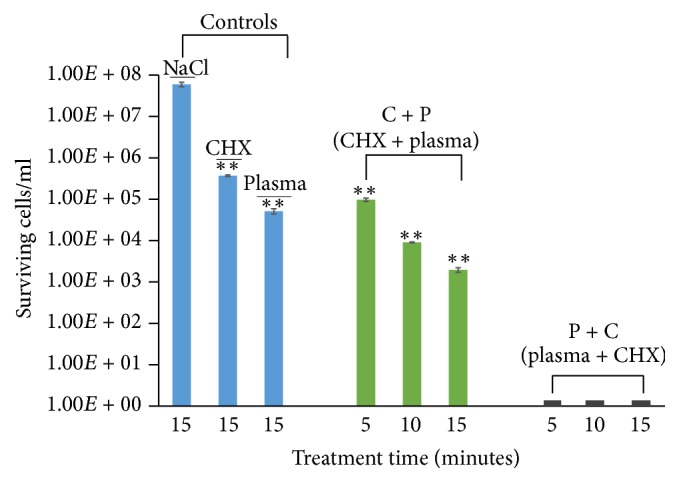
Figure 4.

Surviving bacterial cells of control and treated (C + P and P + C) biofilm. Titanium coupons containing biofilms were treated for different time intervals at 1 kHz frequencies using He jet plasma and CHX. After treatment, the coupon was subjected to the colony count assay (as described in Materials and Methods) and the number of viable cells was calculated. The results are expressed as mean ± standard deviation of cell number (n = 3). Asterisks (∗∗) denote statistical significant differences between NaCl and other treatment groups (C + P, P + C, CHX only, and plasma only), respectively (P < 0.01). P + C (black bar) in the graph represents 0 cells/ml.
