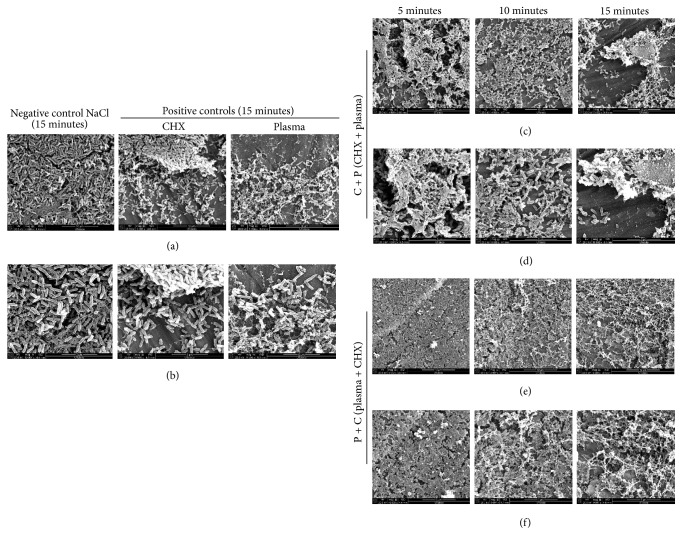
Figure 6.
SEM images of control and treated (C + P and P + C) biofilms on titanium coupons. The titanium coupons (both treated and control) containing biofilms were subjected to SEM and representative images were taken from the coupon. (a) SEM images of biofilms of negative (NaCl) and positive controls (CHX and plasma only). (c, e) SEM images of biofilms after combinatorial treatments: (c) C + P and (e) P + C at different treatment times. Magnification is 5000x, 10 µm, for (a), (c), and (e) and 10000x, 5 µm, for (b), (d), and (f).

