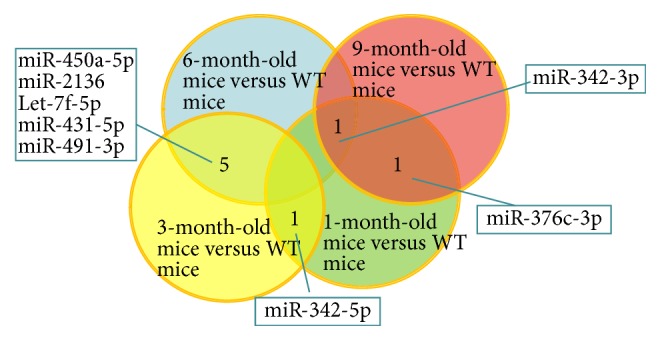
Figure 2.

Venn diagram showing the number of miRNAs significantly changed and intersection of changed miRNAs between each age stage. Green areas show the number of changed miRNAs of 1-month-old mice. Yellow areas demonstrate the number of differentially expressed miRNAs in 3-month-old mice. Blue areas display the number of changed miRNAs in 6-month-old mice. Red areas show the number of differentially expressed miRNAs in 9-month-old AD mice. The intersections indicate the miRNAs that changed in two groups or miRNAs that varied in three groups.
