
Fig. 10.
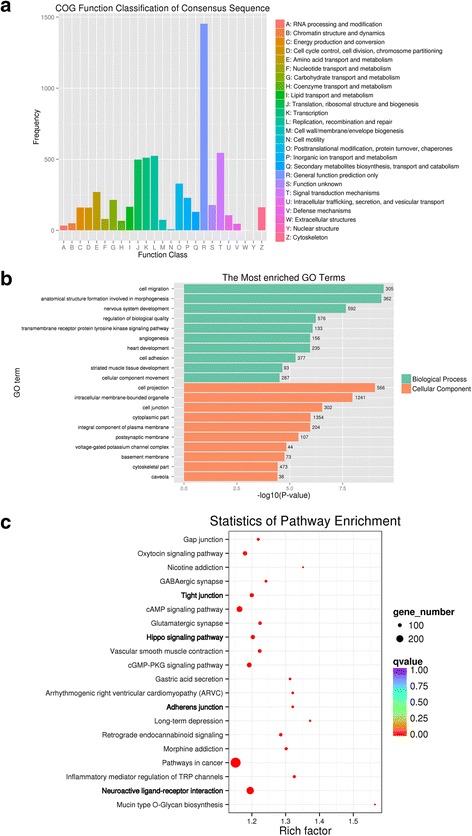
COG, top GO and top KEGG pathway analysis of CG type DMGs. a, COG analysis. b, top GO analysis. c, top KEGG analysis. In graph a, the abscissa represents the COG function classification; the ordinate represents the number of genes that were enriched in this classification. In graph b, the ordinate represents the GO terms that were the most enriched; the abscissa represents the P-value that was calculated using -log10-transformed values; the green and orange colors indicate biological process and cellular component. The size of the circles represent the number of genes contained in the particular class in the graph c, the larger the circle is, the more genes there are; Differently colored circles represent the enrichment degree of false positives, the redder the circle is, the lower is the false positive rate