
Fig. 2.
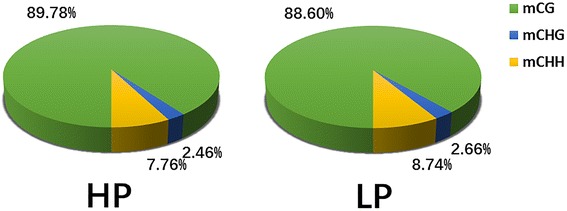
The average ratio of DNA methylation types in the genomes of HP and LP. HP, High Prolificacy. LP, Low Prolificacy, H = A, C or T. The green, blue and yellow colors represent mCG, mCHG and mCHH, respectively
Official websites use .gov
A
.gov website belongs to an official
government organization in the United States.
Secure .gov websites use HTTPS
A lock (
) or https:// means you've safely
connected to the .gov website. Share sensitive
information only on official, secure websites.
The average ratio of DNA methylation types in the genomes of HP and LP. HP, High Prolificacy. LP, Low Prolificacy, H = A, C or T. The green, blue and yellow colors represent mCG, mCHG and mCHH, respectively