
Fig. 7.
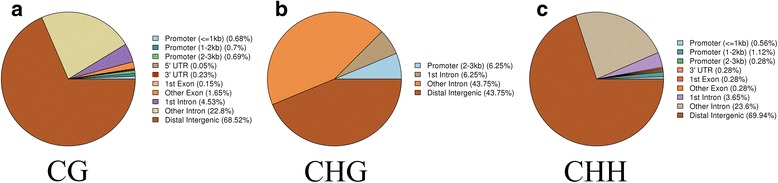
The ratio of DMRs with different methylation types in different gene functional regions. a, CG. b, CHG. c, CHH. H = A, C or T. The blue, dark blue, green, khaki, red, yellow, orange, purple, light yellow and brown colors represent promoter (<=1 kb), promoter (1-2 kb), promoter (2-3 kb),5’UTR, 3’UTR, 1st exon, other exon, 1st intron, other intron and distal intergenic regions, respectively