
Fig. 8.
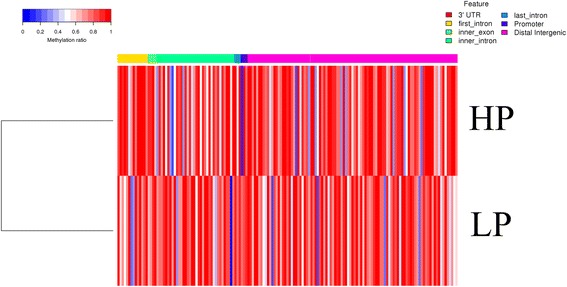
Heat map cluster analysis of DMRs in different gene functional regions. Each column represents an individual DMR and each row represents one group. The colors in each block from blue to white to red sequentially represents the methylation ratio from 0 to 0.5 to 1, respectively. In addition, the red, yellow, green, turquoise, blue, purple and pink colors represent the 3’UTR, first intron, inner exon, inner intron, last intron, promoter and distal intergenic regions respectively which are shown above the heatmap