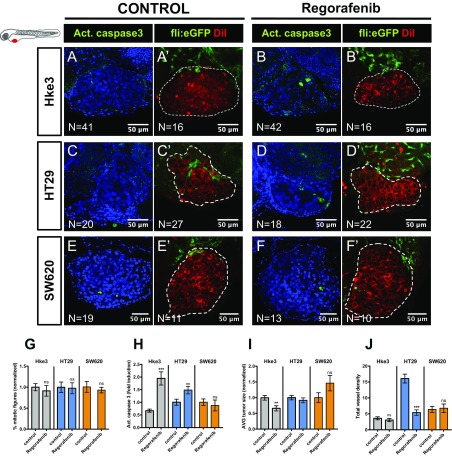
Fig. S4.
Regorafenib third line treatment on Hke3, HT29, and SW620 tumors. Hke3 (A–B′), HT29 (C–D′), and SW620 (E–F′) xenografts were generated in Tg(fli:eGFP) zebrafish to visualize blood vessels. At 24 hpi, xenografts were randomly distributed into control and regorafenib, and treated for three consecutive days. Mitotic index (G) (DAPI in blue), cell death by apoptosis (H) (activated caspase3 in green), and AVG tumor size (I) (number of DAPI cells per tumor) were quantified at 4 dpi. Total vessel density (J) was also quantified. Results are expressed as AVG ± SEM. All pictures are at the same magnification. (Scale bar, 50 μm.) **P < 0.005; ***P < 0.0001; ns, nonsignificant.

