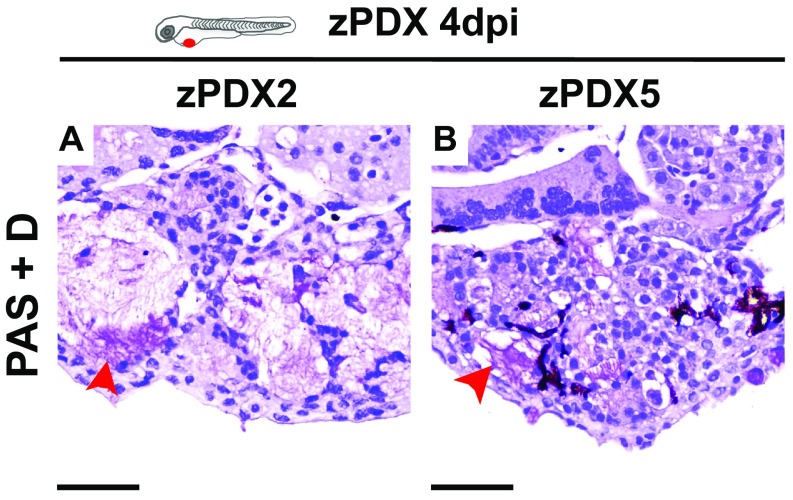
Fig. S6.
PAS+D staining of zPDX sections. Representative microphotographs zPDX tumors derived from patient#2 (A) and patient#5 (B) at 4 dpi; red arrows depict mucin content within glandular structures by PAS+D staining. (Scale bar, 50 μm.) Note that a fine line of agarose inclusion might be detected around the xenograft due to the agarose embedding step prior to paraffin inclusion.

