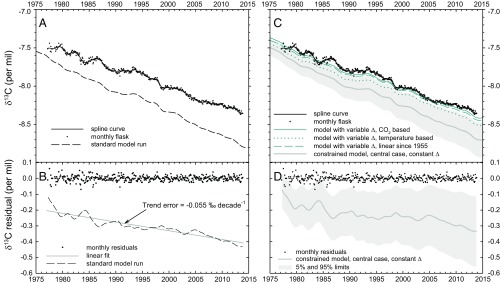
Fig. 1.
Measured and modeled trends in δ13C of atmospheric CO2. Measurements are based on average monthly values at Mauna Loa and South Pole stations, after removing seasonal cycles. (A) Measurements vs. standard model run. (B) Measurements and standard model run as residuals from spline fit. The linear fit through the model residual with slope of −0.055‰ decade−1 quantifies the failure of the standard model to account for the observed δ13C trend. This slope error is independent of the overall offset of the model from the data, which depends on the assumed preindustrial model value of −6.4‰. (C and D) Measurements vs. optimized model run, where the optimization is based on radiocarbon and other constraints, also allowing for ocean warming and wind shift effects (SI Appendix). Gray shading reflects 5% and 95% confidence limits on optimized run. Also shown are runs for three scenarios with variable land discrimination Δ, each of which was optimized to also match the rate of change in δ13C since 1978. All model runs initiated at a value of δ13C = −6.4‰ in year 1765.

