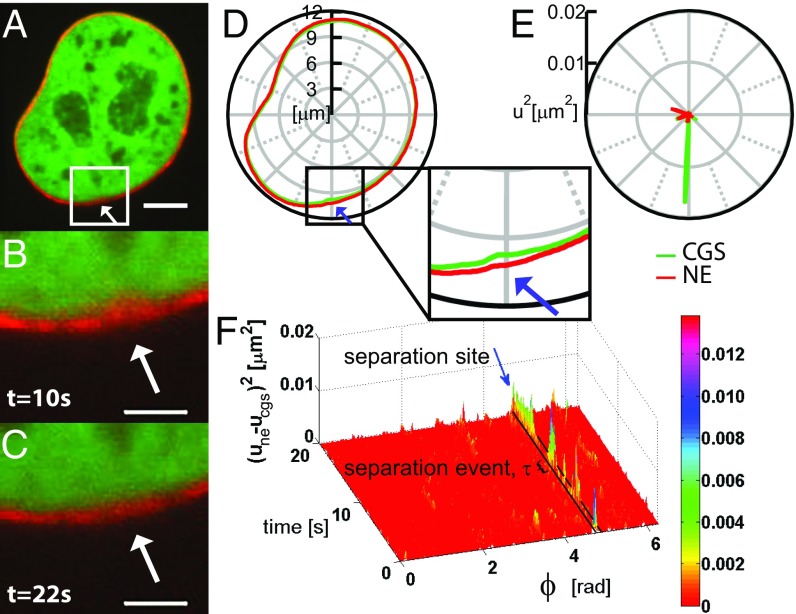
Fig. 3.
Simultaneous measurements of shape fluctuations of CGS and NE. (A) A micrograph of a nucleus expressing both H2B-mCherry (green) and LMNA-GFP (red) obtained using simultaneous two-color confocal microscopy. (B) Inset from A showing a site of local separation (highlighted by white arrow) of CGS and NE at = 10 s, which disappears by (C) time = 22 s. (D) Concurrent contours of CGS (H2B-mCherry) and NE (LMNA-GFP) obtained from A. (Inset) The region from B and C where CGS and NE locally separate (highlighted by blue arrow). (E) Fluctuations for the contours of CGS and NE from D. (F) Visualization of the separation sites of CGS and NE, by plotting as a function of polar angle and time ; and are the deviations of the NE and CGS contours from their respective average contours. The black box highlighted by blue arrow demarks the temporal evolution of the separation site from D. The black bracket shows one separation event of duration . [Scale bar, (A) 5 μm; (B and C) 2 μm.]

