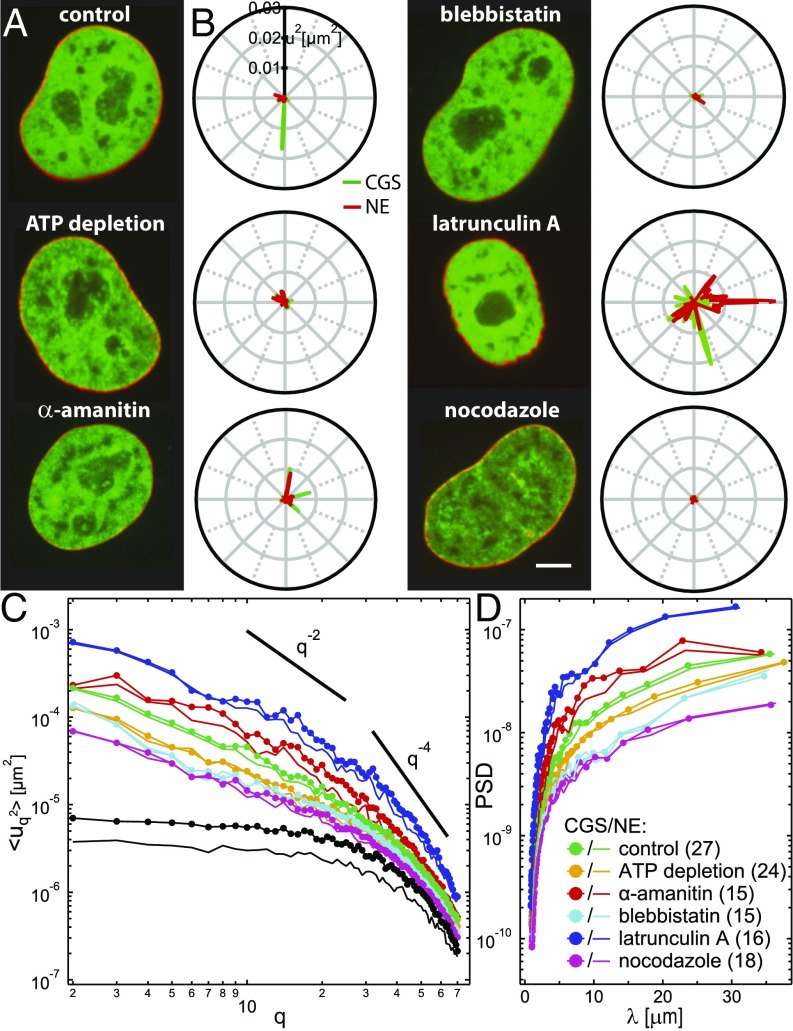
Fig. 4.
Simultaneous measurements of shape fluctuations of CGS and NE upon biochemical perturbations. (A) Micrographs of cell nuclei expressing both H2B-mCherry (green) and LMNA-GFP (red) under the following conditions: control, after ATP depletion, and upon addition of -amanitin, blebbistatin, latrunculin A, and nocodazole. (B) Fluctuations of CGS (green) and NE (red) for each condition from A at one time point. Average and instantaneous contours for CGS and NE are shown in Fig. S6. (C) Wavenumber-dependent under the following conditions: control (n = 27), ATP depletion (n = 24), -amanitin (n = 15), blebbistatin (n = 15), latrunculin A (n = 16), and nocodazole (n = 18) treatment. Black curves represent negative control by fixation with formaldehyde for CGS (markers) and NE (no markers). Solid black lines illustrate slopes and . Error bars are shown in Fig. S6. (D) PSD of as a function of wavelength upon different perturbations. (Scale bar, 5 μm.)

