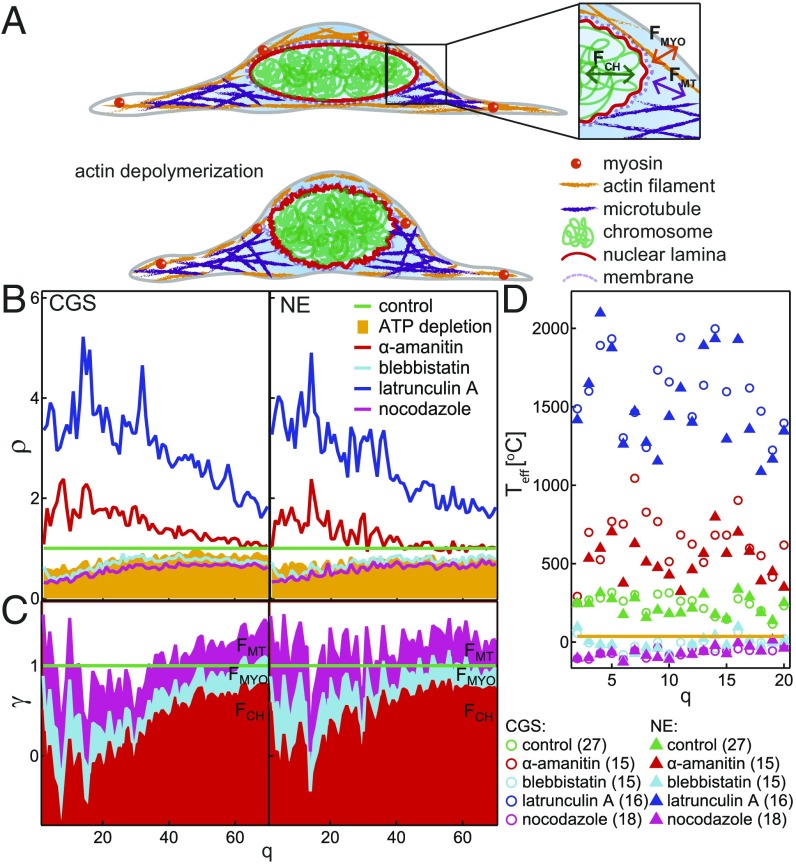
Fig. 5.
Active and passive dynamics of CGS and NE. (A) Cartoon of a control cell (Top) and after actin depolymerization (Bottom). Inset illustrates the fluctuations of the NE caused by chromatin, , microtubules, , and myosin II, . (B) The ratio shows the changes in fluctuations of CGS and NE upon different perturbations. (C) Cumulative plot of the passive contribution (baseline ) and relative active contributions of chromatin, microtubules, and myosin II amounts to 1. (D) for different perturbations.

