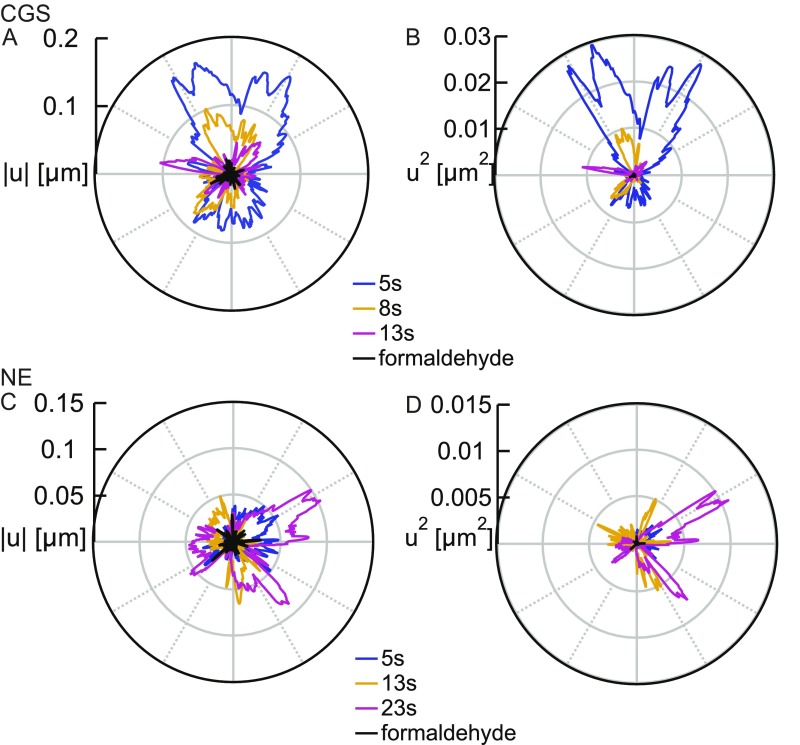
Fig. S1.
In vivo measurements of the shape fluctuations of the CGS and NE. (A) Fluctuations calculated for the contours of CGS from Fig. 1B at = 5, 8, and 13 s. (B) Fluctuations calculated for the contours of CGS from Fig. 1B at = 5, 8, and 13 s. (C) Fluctuations calculated for the NE contours from Fig. 1E at = 5, 13, and 23 s. (D) Fluctuations calculated for the NE contours from Fig. 1E at = 5, 13, and 23 s. In addition, in A–D, we plot and for samples fixed with formaldehyde (black), demonstrating that our measurements are well above the noise floor.

