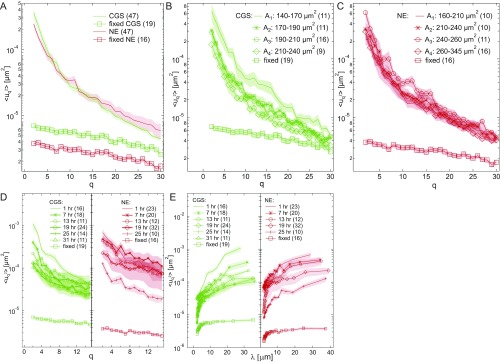
Fig. S2.
Shape fluctuations of CGS and NE are cell cycle-dependent. (A) Wavenumber-dependent fluctuations with error bars (SE) calculated for CGS (H2B-GFP, green solid line, n = 47) and NE (LMNA-GFP, red solid line, n = 47). (B) The of CGS calculated with error bars (SE) for four groups determined based on their measured nuclear area . (C) The of NE calculated with error bars (SE) for four groups determined based on their measured nuclear area . (D) Wavenumber-dependent fluctuations with error bars (SE) of CGS (green) and NE (red) measured at different times during the cell cycle; for both CGS and NE exhibits a monotonous decrease with increasing time during the cell cycle. (E) Wavenumber-dependent fluctuations as a function of wavelength with error bars (SE) of CGS (green) and NE (red) measured at different times during the cell cycle.

