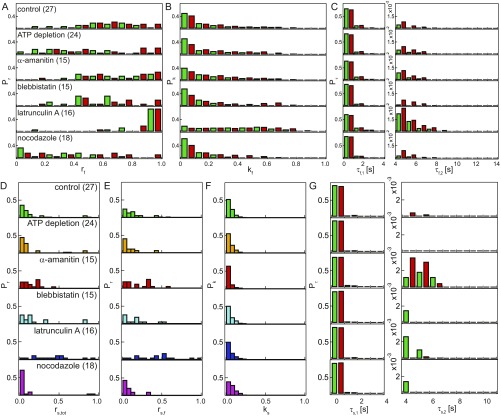
Fig. S5.
Analysis of fluctuation sites upon different perturbations. (A) Histogram of ratio of fluctuation sites for each condition. Ratio of fluctuation sites was determined by counting the sites with fluctuation () along the nuclear contour and normalized by its length. Green bars represent the fluctuations for CGS, where , and red bars represent the fluctuations for NE, where . (B) Histograms of fluctuation rate at each condition. The rate of a fluctuation site was calculated by counting the time points with fluctuations at that fluctuation site and normalized by the length of measurement (20 s). (C) Histogram of fluctuation duration for every condition; shows the region of short duration, and shows the region of long duration. (D) Histogram of ratio of separation sites for each condition. Ratio of separation sites was determined by counting the sites with separation along the nuclear contour and normalized by its length. (E) Histogram of the fraction of separation sites distribution calculated by normalizing data from D by the average value of obtained from A for each condition. (F) Histogram of separation rate at each condition. The rate of a separation site was calculated by counting the time points with separation at that separation site and normalized by the length of measurement (20 s). (G) Histogram of separation duration for every condition; shows the region of short duration, and shows the region of long duration. Green bars represent for , and red bars represent the for .

