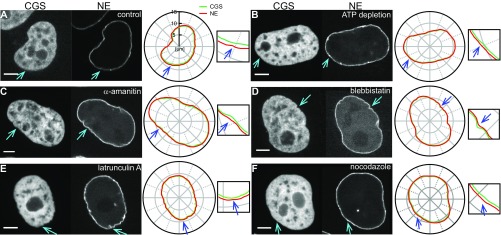
Fig. S7.
Example of separation sites exhibited upon different biochemical perturbations. Specifically, micrographs and instantaneous contours for CGS and NE are shown for (A) control, (B) after ATP depletion, and upon treatment with (C) -amanitin, (D) blebbistatin, (E) latrunculin A, and (F) nocodazole. The separation sites are highlighted by blue arrows in the CGS and NE images and contours. (Scale bar, 5 μm.)

