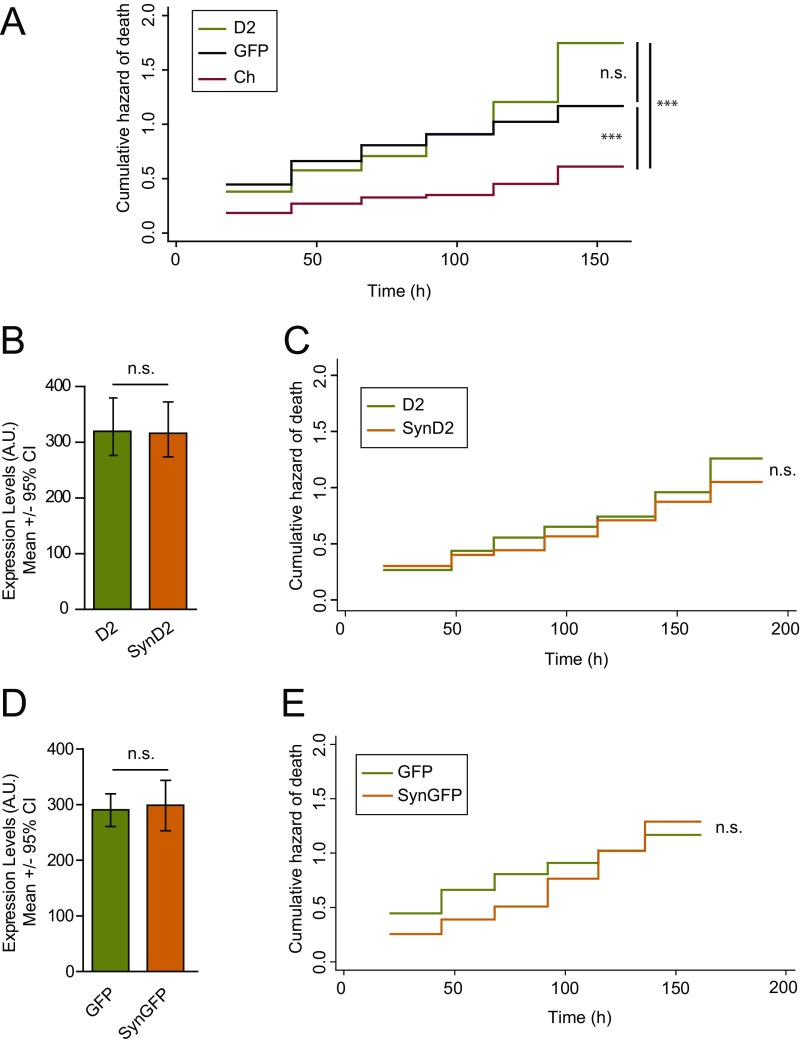
Fig. S2.
Ch, D2, and GFP fluorescent proteins affect the survival of cortical neurons distinctly. (A) Cumulative risk estimates of primary neurons transfected with Ch, D2, and GFP (D2 = 386, GFP = 210, and Ch = 141 neurons, respectively; log-rank test; n.s., nonsignificant, ***P < 0.001). (B) Cohorts of neurons expressing similar levels of D2 and SynD2 were selected for further analysis of the risk of neuronal death (D2 = 119 and SynD2 = 125 neurons, respectively; Mann–Whitney test; n.s., nonsignificant). (C) The risk of death of cohorts of neurons expressing similar levels of WT aSyn (SynD2) and control protein D2 (from B) was compared (log-rank test; n.s., nonsignificant). (D) Cohorts of neurons expressing similar levels of GFP and SynGFP were selected (SynGFP = 132 and GFP = 210 neurons; Mann–Whitney test; n.s., nonsignificant). (E) The risk of death in cohorts of neurons was compared after expressing similar levels of WT aSyn (SynGFP) and control protein GFP (from D; log-rank test; n.s., nonsignificant). All error bars represent the 95% CIs.

