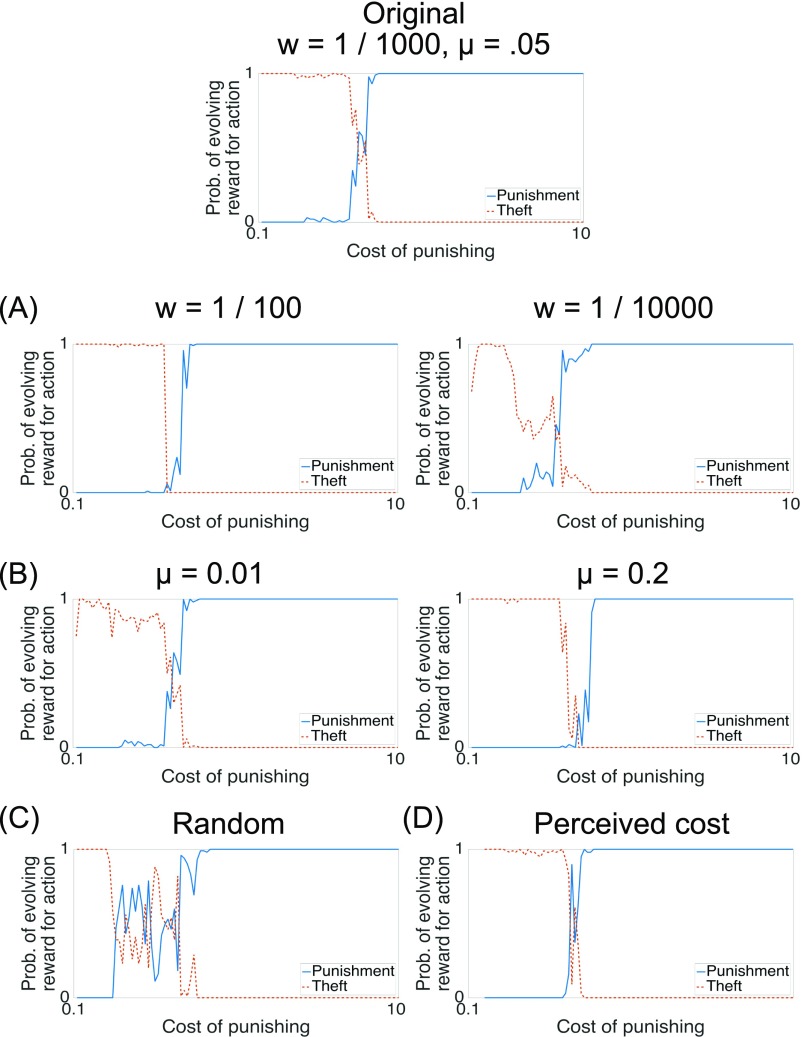
Fig. S6.
(A and B) Combined evolutionary and RL simulations, across different selection intensities (A) and mutation rates (B). (C) We randomly sample the learning parameters for each match, with from and from . (D) We manipulate the perceived cost of punishing while holding the actual cost constant, to demonstrate that our effect is due to the cost’s influence on the learning dynamics (Isolating the Effect of Learning Dynamics). The x-axis scale is linear for all graphs. Prob., probability.

