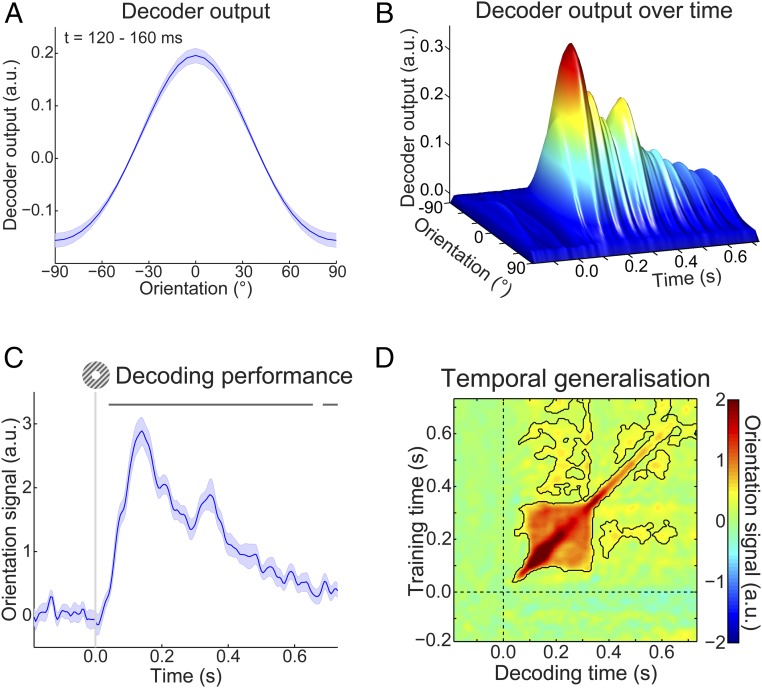
Fig. 2.
Localizer orientation decoding. (A) The output of the decoder consisted of the responses of 32 hypothetical orientation channels; shown here are decoders trained and tested on the MEG signal 120–160 ms poststimulus during the grating localizer (cross-validated). Shaded region represents SEM. (B) Decoder output over time, trained and tested in 5-ms steps (sliding window of 29.2 ms), showing the temporal evolution of the orientation signal. (C) The response of the 32 orientation channels collapsed into a single metric of decoding performance (SI Materials and Methods) over time. Shaded region represents SEM; horizontal lines indicate significant clusters (P < 0.05). (D) Temporal generalization matrix of orientation decoding performance obtained by training decoders on each time point and testing all decoders on all time points (as above, steps of 5 ms and a sliding window of 29.2 ms). This method provides insight into the sustained vs. dynamical nature of orientation representations (15). Solid black lines indicate significant clusters (P < 0.05); dashed lines indicate grating onset (t = 0 s).

