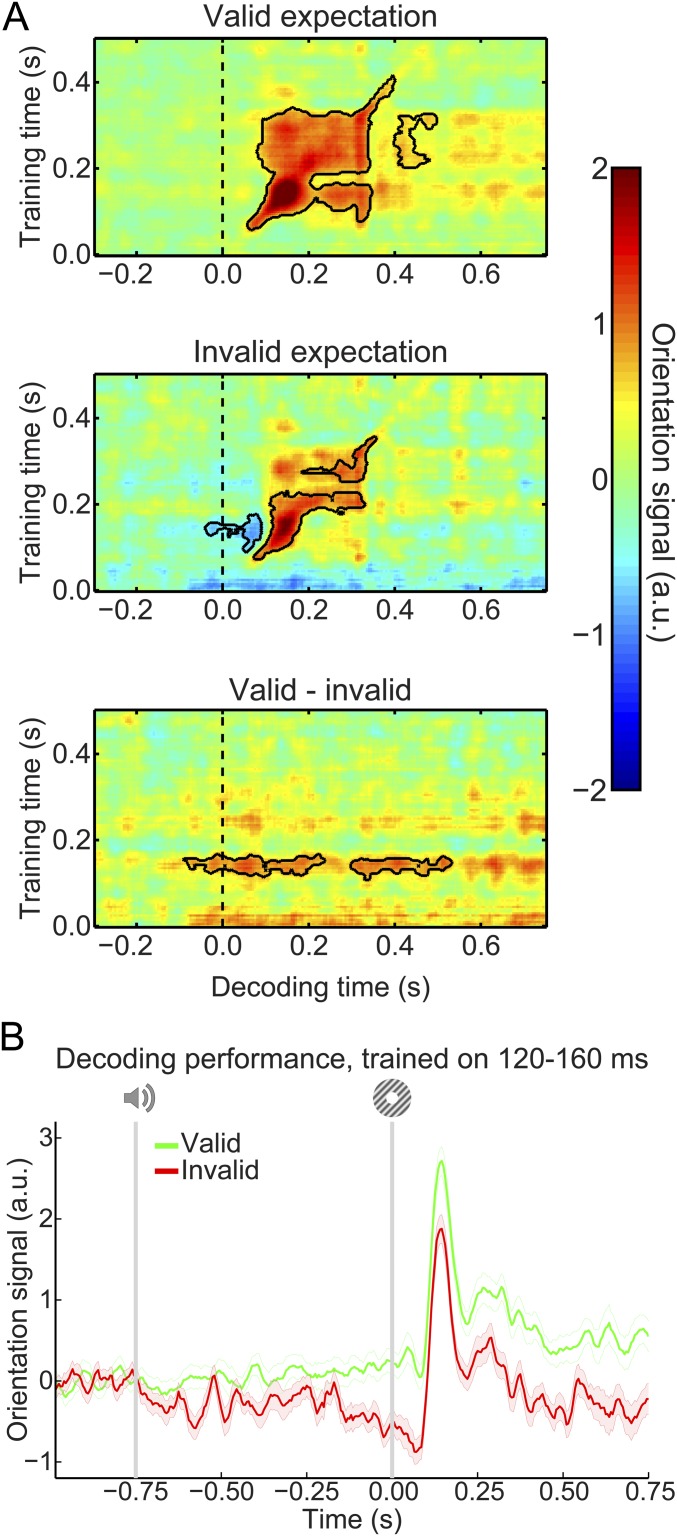
Fig. S6.
Expectation effects in the absence of low-pass filtering. (A) Temporal generalization matrices of orientation decoding during the main experiment without low-pass filtering the data. Otherwise, it is identical to Fig. 3A. Solid black lines indicate significant clusters (P < 0.05). (B) Orientation decoding during the main task averaged over training time 120–160 ms poststimulus during the grating localizer. Shaded regions indicate SEM.

