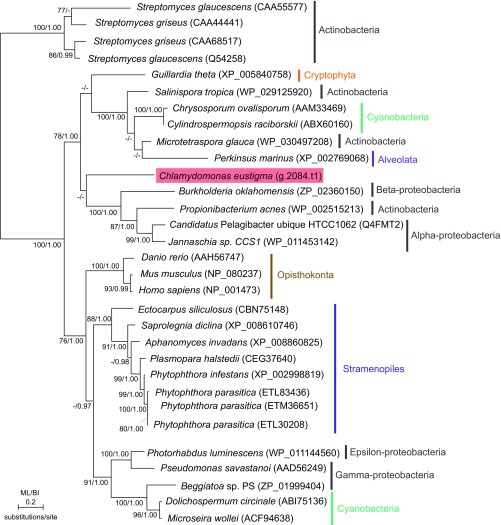
Fig. S3.
Phylogenetic relationship of AMGT proteins. The tree was constructed by the ML method (RaxML 8.0.0). ML BP >50% obtained by RaxML and BI >0.95 obtained by Bayesian analysis (MrBayes 3.2.6) are shown above the branches. The branch lengths reflect the evolutionary distances indicated by the scale bar. The accession numbers of the respective amino acid sequences are indicated with the species names.

