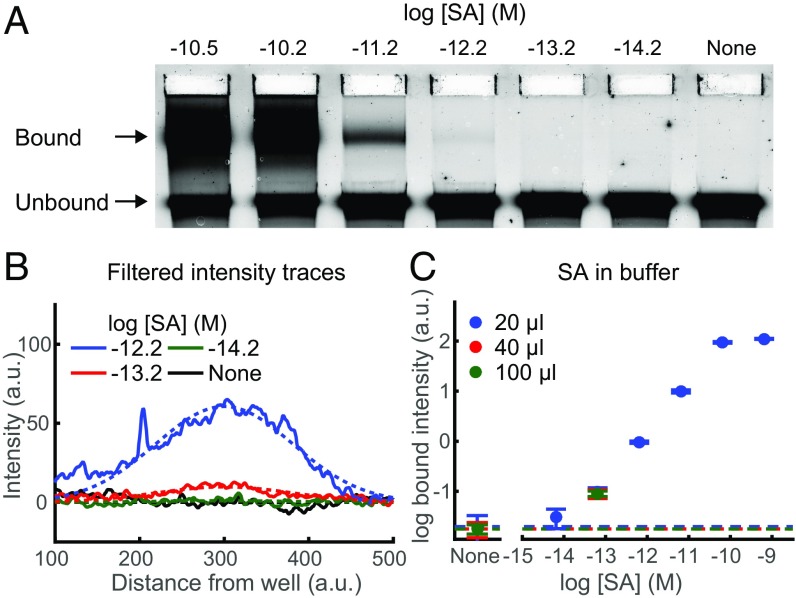
Fig. 2.
DNA nanoswitch detection of streptavidin (SA) in buffer. (A) Representative gel image of SA spiked into buffer, with concentrations ranging from 6.1 × 10⁻¹⁵ to 3.2 × 10⁻¹⁰ M labeled in a log base 10 scale, and a control lane lacking any SA. (B) Representative filtered intensity traces (solid lines) with fitted skew normal and background (dashed lines) for concentrations ranging from 6.1 × 10⁻¹⁵ to 6.1 × 10⁻¹³ M and also a control lane lacking any SA. (C) Log-log plot of average bound intensity per lane as a function of concentration for SA in buffer. Results are for 20 μL of sample run in one gel lane, 40 μL of sample run across two gel lanes, or 100 μL run across five gel lanes. Error bars are the SD, with the background given by the dashed lines, with four replicates per data point.

