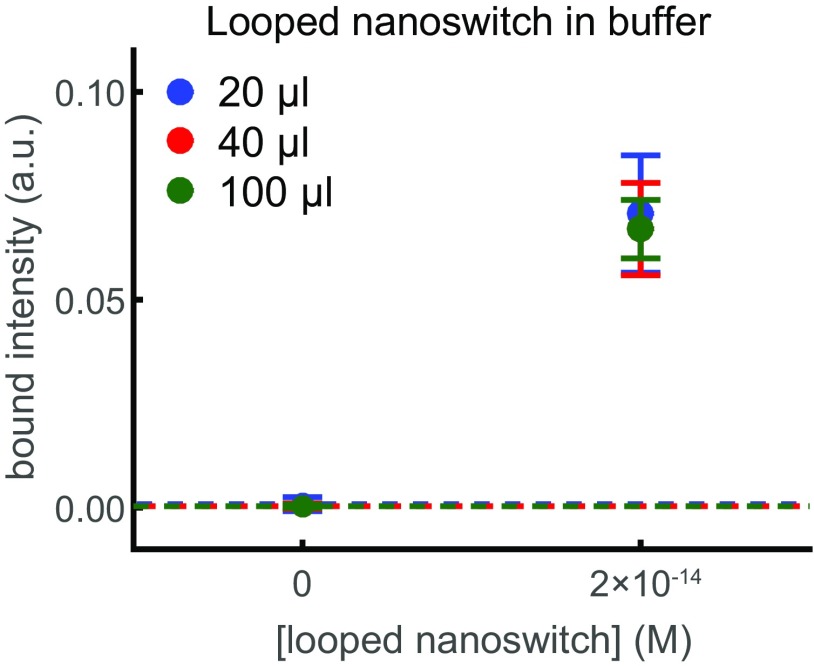
Fig. S2.
Detection of looped DNA nanoswitch in buffer. Average bound intensity per lane as a function of concentration in buffer. Results are for 20 μL of sample run in one gel lane (blue), 40 μL of sample run across two gel lanes (red), or 100 μL of sample run across multiple gel lanes (green). Error bars are the SD over eight replicates, with the background given by the dashed line.

