Fig. 3.
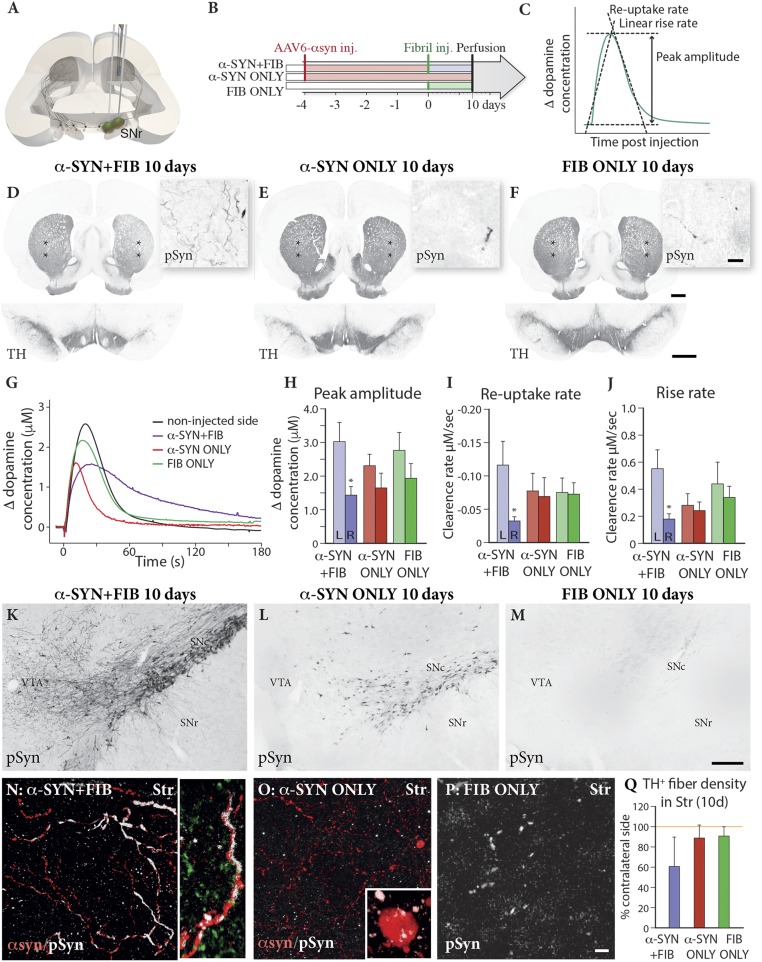
Impact on DA release assessed by in vivo amperometry. Animals received injections in the medial and lateral parts of the SN (A) of AAV–α-syn followed 4 wk later by injections of PFF (α-SYN + FIB), vehicle (α-SYN ONLY), or PFF alone (FIB ONLY) (B). (C) Chronoamperometry recordings of K+-evoked DA release were performed bilaterally from nafion-coated electrodes placed in the centrolateral part of the striatum at 10 d after PFF injection (position marked with stars on the TH-immunostained sections in D–F). (Scale bars: D–F, 1 mm for striatum and SN; D–F, Insets, 20 μm.) In the combined α-SYN + FIB group, the impact of the treatment was seen as a release curve with a lower peak and a broader kinetic profile (purple curve in G). Peak amplitude (H), reuptake rate (I), and release rate (J) were significantly reduced in the α-SYN + FIB animals (*P < 0.05, compared with control side, paired t test: peak amplitude, t(10) = 2.815, P = 0.0183; rise rate, t(9) = 2.647, P = 0.0266; and reuptake rate, t(10) = 3.097, P = 0.0113. Multivariate ANOVA showed a significant difference in peak amplitude and reuptake rate between sides, F(1, 27) = 13.50, P = 0.001, and F(1, 26) = 6.54; P = 0.017, but not in rise rate, F(1, 26) = 2.68, P = 0.114. The accumulation of p-Syn in SN and α-syn–expressing axonal processes in the striatum was much more pronounced in the combined α-SYN + FIB animals (K and N) than in the α-SYN ONLY (L and O) and the FIB ONLY (M and P) groups, accompanied by a trend toward a decrease in TH+ fiber density in the striatum in the α-SYN + FIB group (Q) F(2, 11) = 3,31, P = 0.074. (Scale bars: K–M, 200 μm; N–P, 10 μm.) The photographs in K–M were generated by stitching of images captured at 40× magnification in the microscope.

