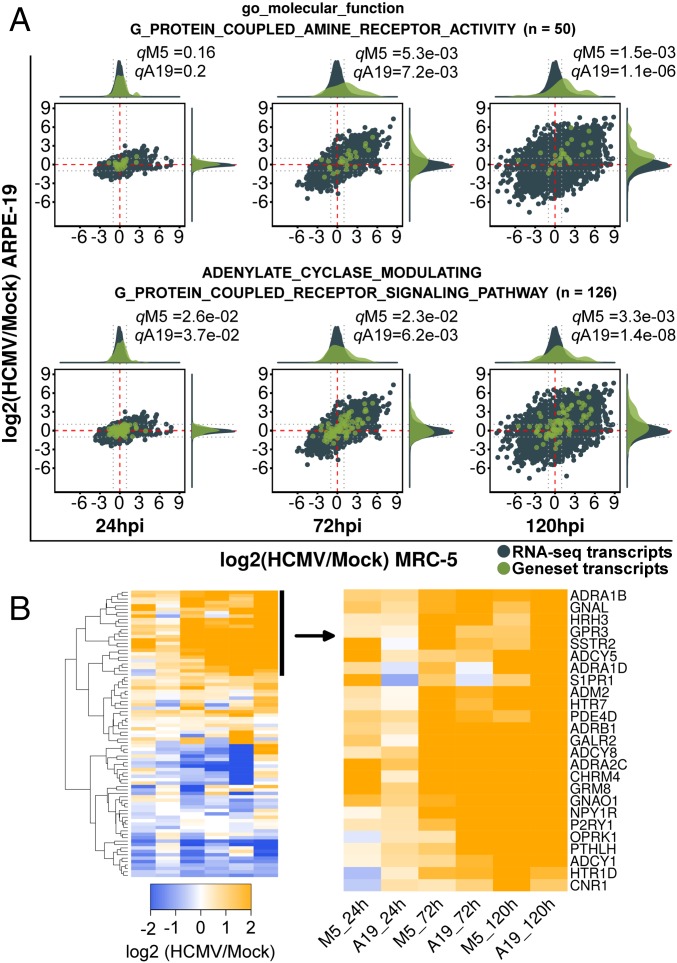
Fig. 3.
GSEA analysis of the monoamine GPCR temporal community. (A) RNA-seq ratio scatterplots of representative gene sets partitioned into the monoamine GPCR community. Distribution density plots used for significance testing are displayed Above and to the Right of each scatterplot. Dotted gray lines are twofold reference guides. RNA-seq transcripts and distributions are shown in blue, while those from each gene set are shown in green. (B) Heatmap of the union of gene sets shown in A showing up-regulated and down-regulated transcripts grouped by hierarchical clustering.

