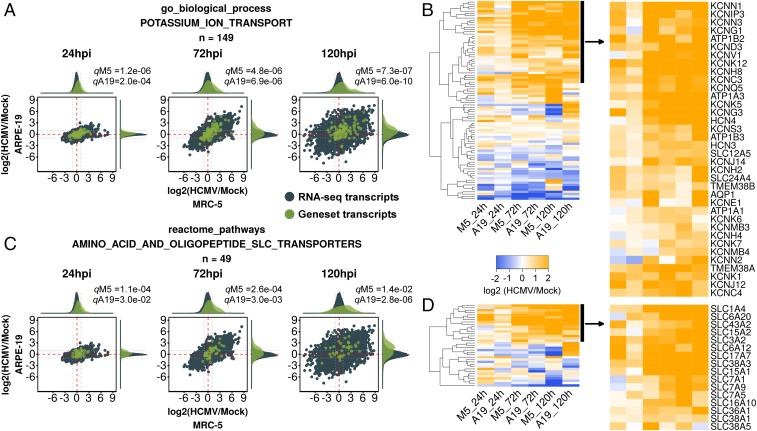
Fig. 4.
GSEA analysis of the ion and small molecule transport community. (A and B) RNA-seq ratio scatterplots and up-regulated transcripts (as in Fig. 3) of GO biological process gene set “potassium ion transport.” This gene set is a representative potassium transport gene set from the ion and small molecule transport community. (C and D) RNA-seq ratio scatterplots and up-regulated transcripts (as in Fig. 3) of reactome gene set “amino acid and oligopeptide SLC transporters.” This gene set is a representative amino acid transport gene set from the ion and small molecule transport community.

