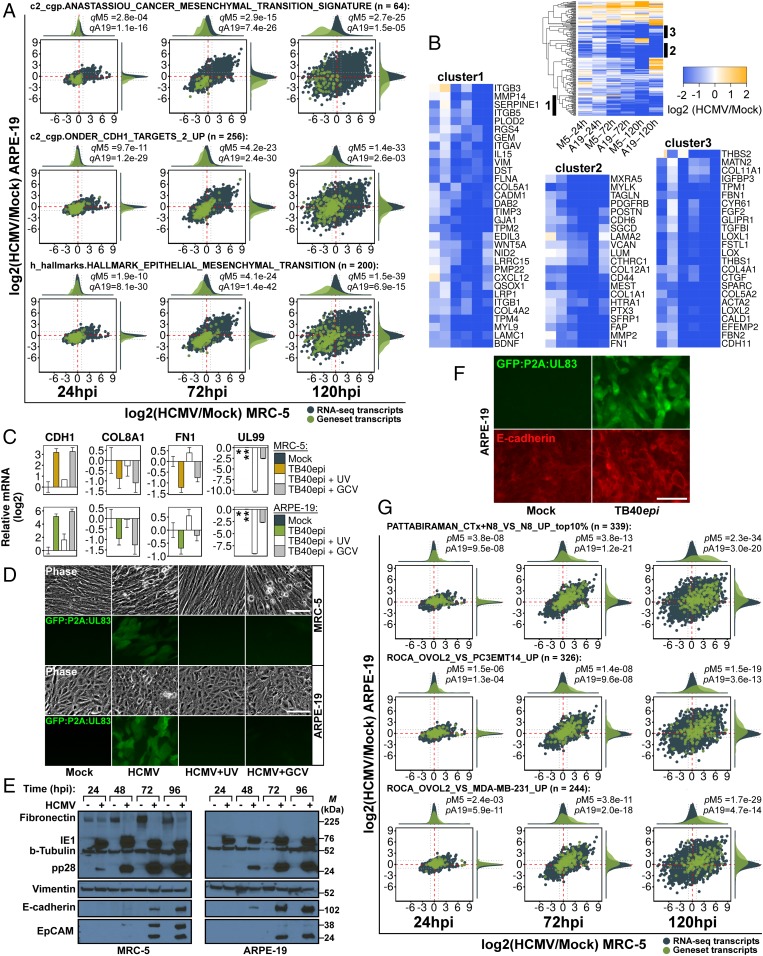
Fig. 6.
Inhibition of EMT and induction of MET during HCMV infection. (A) RNA-seq ratio scatterplots of representative EMT-related gene sets from the adhesion#1 community. (B) Heatmap and down-regulated clusters of hallmark epithelial mesenchymal transition gene set. (C) Effect of UV and ganciclovir (GCV; 100 μM) treatment on CDH1, COL8A1, FN1, and UL99 at 72 hpi. Samples were calibrated to mock, except for UL99, which was calibrated to TB40epi (**), since the mock (*) sample was not assayed. Data are mean ± SD from three separate infections, each assayed in technical triplicate. (D) Phase-contrast and fluorescence images of cell populations from C, showing inhibition of late gene expression due to UV and GCV treatment. (E) Western analysis of EMT and MET markers during HCMV infection in MRC-5 and ARPE-19 cells. M, marker (kDa). (F) Immunostaining of E-cadherin (red) in mock and infected ARPE-19 cells. Infected cells are marked with GFP expressed from the virus-encoded GFP:P2A:UL83 reporter. (G) RNA-seq ratio scatterplots of MET gene sets during HCMV infection. (Scale bars, 100 μm.)

