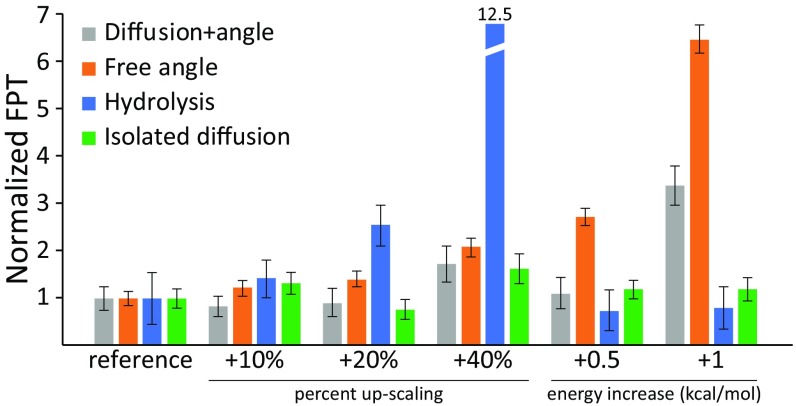
Fig. 2.
Average first passage times (FPT) for the lever angle transition of a bound head (gray; entailing diffusion) for a free head (orange), and for hydrolysis (blue) are shown for different energy scaling. Error bars express the SEM (n > 11). “Reference” is the scaled landscape from Fig. 1. A potential where the lever angle potential is flat is shown in green to present isolated diffusion.

