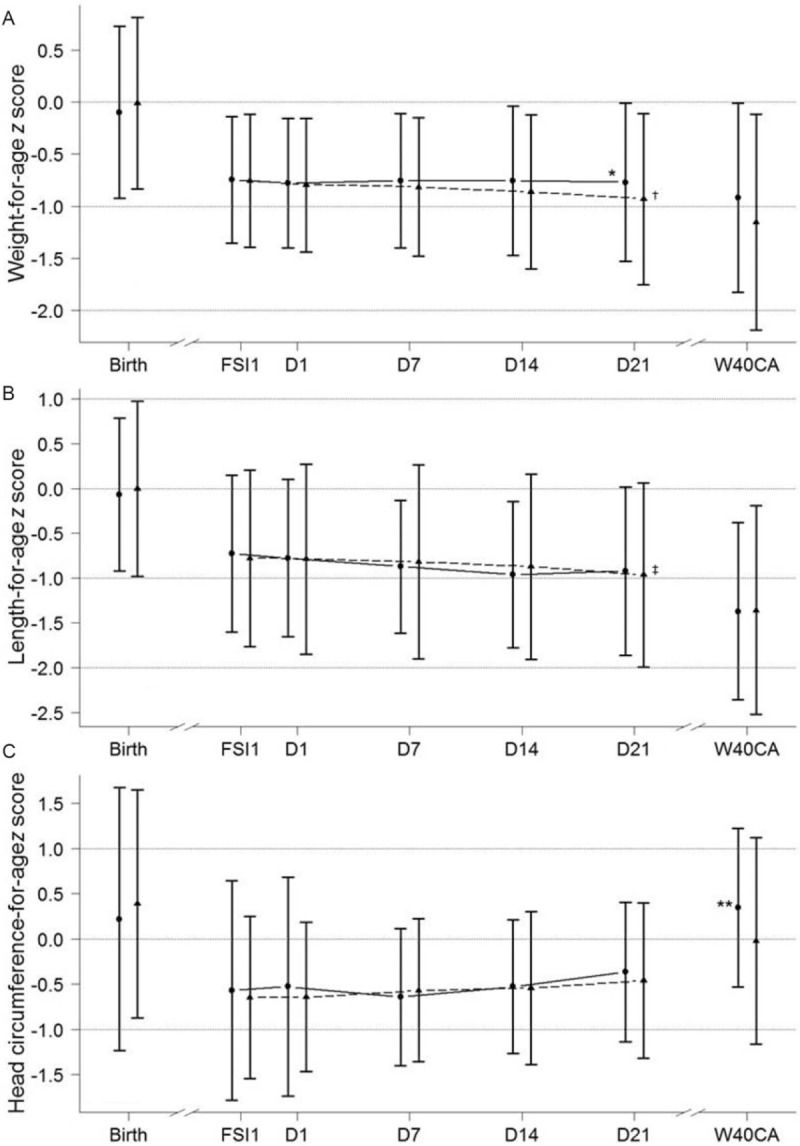
FIGURE 3.

Mean ± SD weight-for-age (panel A), length-for-age (panel B), and head circumference-for-age (panel C) z scores for the overall ITT population. Circle symbols/solid line represents nHMF. Triangle symbols/dashed line represents cHMF. FSI1 = fortification strength increase day 1; ITT = intent-to-treat; SD = standard deviation; W40CA = week 40 corrected age; z scores calculated using Fenton preterm growth chart (25). ∗P = 0.013 vs cHMF (by analysis of covariance, adjusting for value at D1, sex, and center); †P = 0.007 vs day 1 (by t test); ‡P = 0.041 vs day 1 (by t test); ∗∗P = 0.003 vs cHMF (by analysis of covariance, adjusting for value at D1, sex, and center).
