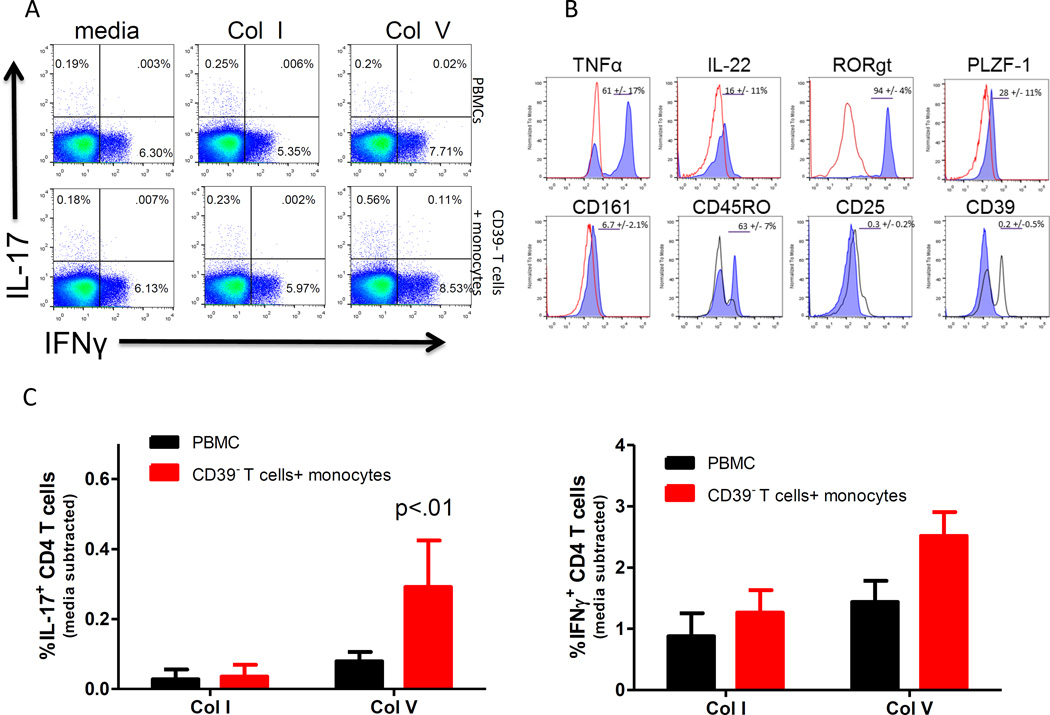
Figure 2.
Col V specific IL-17 production from normal, healthy individuals is revealed when CD39+ T cells are removed. (A) Representative flow plots of IL-17 and IFNγ production from overnight cultures of whole PBMCs (top) or CD39− T cells plus autologous monocytes (bottom) stimulated with Col I or Col V from a normal, healthy individual. Inset numbers represent percentage in each quadrant. (B and C) Quantified flow cytometry data from panel A indicating frequencies of IL-17 or IFNγ producing CD4 T cells from 7–10 normal, healthy individuals. P value represents significance vs PBMC-Col V stimulated control. (D) Representative histograms of TNFα, IL-22, PLZF-1, RORγt, CD45RO, CD161, CD39 and CD25 (blue) expression gated from total IL-17+ populations of Col V stimulated cells from the CD39− Tcells plus monocyte groups. Red line represents isotype control (TNFα, IL-22, PLZF-1, RORγt, CD161), black line represents staining from CD3+/CD4+ T cells that are both IL-17 and IFNγ negative (CD45RO, CD39, CD25). Significant differences between groups were determined by ANOVA or Mann Whitney U tests.

