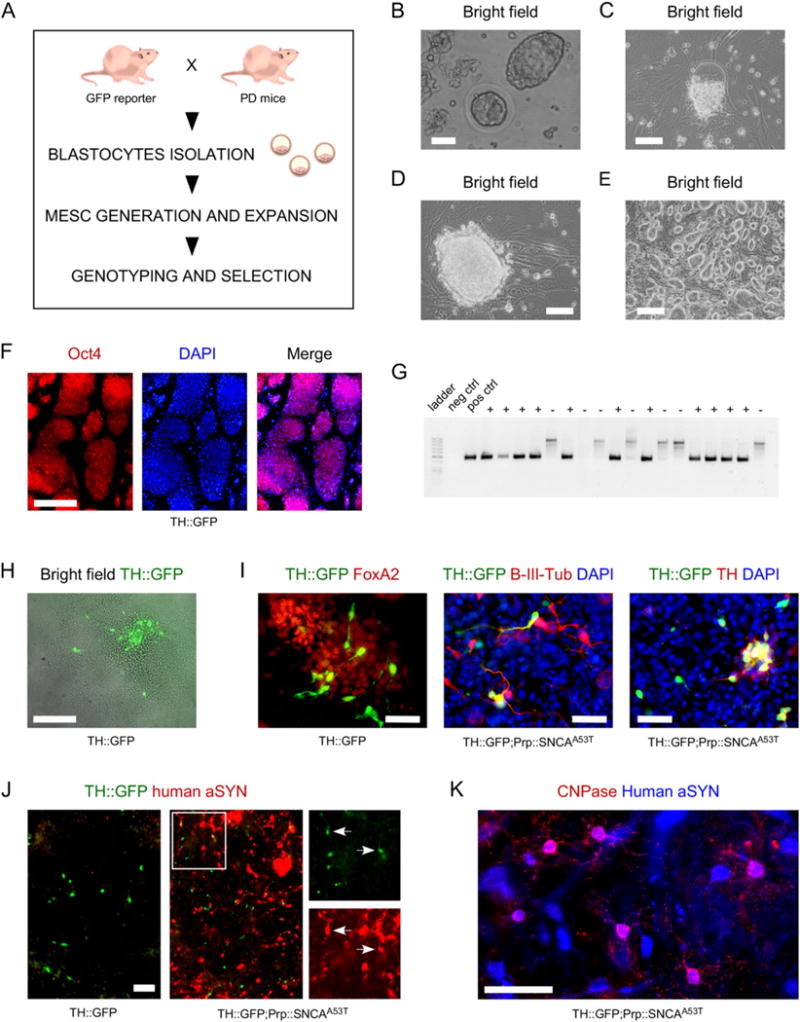
Fig. 1.

A- Schematic representation of the workflow to generate mESC lines. B- Bright field images of blastocysts aged E3.5, in culture medium, prior to seeding on MEFs. Scale bar = 50 μm. C- Inner cell mass migrating out to form a colony on MEFs. The zona pelucida can be identified above the newly formed colony. Scale bar = 50 μm. D- Seven day old newly formed colony. Scale bar = 50 μm. E- Culture of mESC line aged passage P4. Scale bar = 100 μm. F- Established mESC culture stained for pluripotency marker Oct4 (red); cell nuclei are counterstained with DAPI (blue). Scale bar = 100 μm. G- Example of gel allowing identification of clones positive for GFP revealed by the presence of a PCR product of 475 bp. “+” indicates positive clones; “−” indicates negative clones. H– Identification of TH∷GFP-expressing cells in a mESC colony differentiated on PA6 cells. Scale bar = 100 μm. I- TH∷GFP-positive cells co-express FoxA2 (87 ± 8%), β-III-tubulin (70 ± 11%) and TH (59 ± 10%). Mean ± SD. Scale bars = 50 μm. J-Differentiated TH∷GFP;Prp∷hSNCAA53T mESC lines, but not differentiated TH∷GFP mESC lines, do stain positive for human aSYN. Scale bar = 100 μm. K- Human aSYN expression identified in CNPase oligodendrocytes in Prp∷hSNCAA53T cultures. Scale bar = 100 μm.
