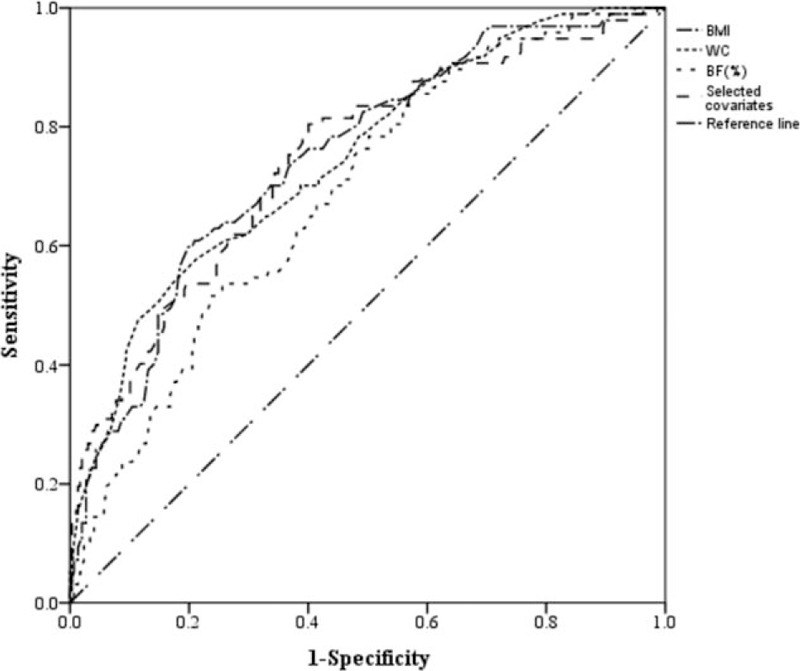
Figure 5.

ROC curves for WC, BMI, BF%, and selected covariates as predictors of IR. BF% = body fat percentage, BMI = body mass index, IR = insulin resistance, ROC = receiver operating characteristic curve, WC = waist circumference.

ROC curves for WC, BMI, BF%, and selected covariates as predictors of IR. BF% = body fat percentage, BMI = body mass index, IR = insulin resistance, ROC = receiver operating characteristic curve, WC = waist circumference.