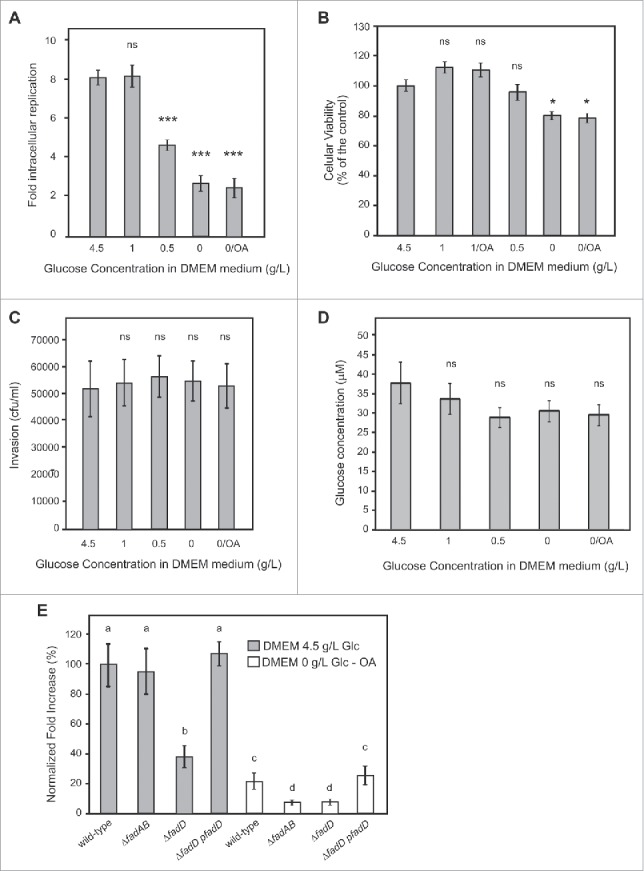
Figure 3.

Analysis of Salmonella intracellular replication, internal glucose concentration, and macrophages viability and phagocytic capacity in presence of different concentration of glucose in the infection medium. (A-D) Activated RAW 264.7 macrophages grown in the presence of different concentrations of glucose (from 0 to 4.5 g/L) or with oleic acid were used for different assays. (A) RAW 264.7 cells were infected with wild-type strains and lysed at 2 and 16 hours post infection for enumeration of intracellular bacteria. The values shown represent the fold increase calculated as a ratio of the intracellular bacteria between 16 and 2 hours. Values are means ± SD (n = 4). (B) Cell viability was evaluated by MTT assay. (C) RAW 264.7 macrophages were infected with wild-type strains and lysed at 2 hours for enumeration of intracellular bacteria. (D) RAW 264.7 cells were grown for 24 hours, collected by centrifugation, and lysed. Glucose concentration was determined by a fluorometric assay.74 (A-D) Values are means ± SD of 3 independent experiments. An unpaired t-test was used to determine whether a value was significant different from the control. ns, not significant; *, P < 0.05; ***, P < 0.001. (E) Activated RAW 264.7 macrophages were infected with wild-type, β-oxidation mutants (ΔfadBA, ΔfadD), or a complemented (ΔfadD-pfadD) strains and lysed at 2 and 16 hours post infection for enumeration of intracellular bacteria. The values shown represent the fold increases calculated as a ratio of the intracellular bacteria between 16 and 2 hours and normalized to that of the wild-type strain in DMEM medium supplemented with 4.5 g/L of glucose. Normalized fold increase of wild type strain in DMEM media supplemented with oleic acid or mutants in both media against the wild-type (WT) strain in DMEM media supplemented 4.5 g/l of glucose were determined. Values are means ± SD of 3 independent experiments. One-way ANOVA and Tukey post-tests were used to determine whether the values were significantly different. Different letters (a, b, c, and d) indicate statistically significant differences between groups (mean ± SE). P-values: a vs. b, P < 0.05; a vs. c and a vs. d, P < 0.001; c vs. d P < 0.01.
