
Figure 9.
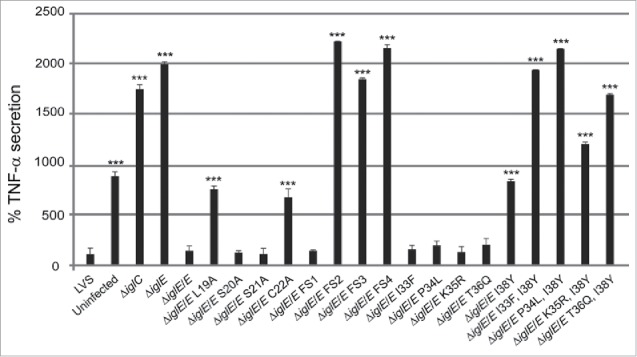
TNF-α secretion of F. tularensis infected macrophages. Uninfected J774 cells or cells infected with F. tularensis at an MOI of 500 for 2 h were washed and subsequently incubated in the presence of E. coli-derived LPS (50 ng/ml) for an additional 2 h. The average TNF-α secretion in % compared with LVS, which was set as 100 %, and the SD of quadruple samples (n = 4) from 2 or more representative experiments, are shown. The asterisks indicate that the cytokine levels were significantly different than those of LVS-infected cells as determined by a 2-sided t-test with equal variance, including the Bonferroni correction for multiple pair-wise comparisons (*, P ≤ 0.05; ***, P ≤ 0.001).