Figure 2.
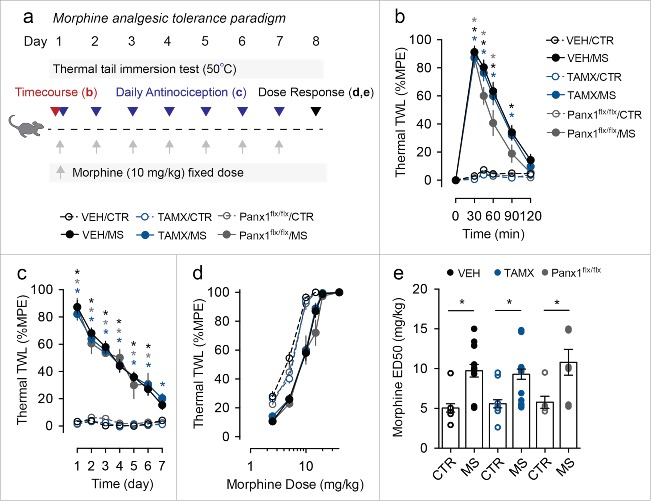
Genetic deletion of microglial Panx1 does not impact acute response to morphine or the development of morphine analgesic tolerance. (a) Schematic depicting morphine dosing and behavioral testing paradigm for morphine analgesic tolerance experiments. (b) Time course of antinociceptive response to an acute injection of morphine sulfate (MS) or saline (CTR) in vehicle (VEH) and tamoxifen (TAMX) treated Cx3cr1-CreERT2::Panx1flx/flx mice, and tamoxifen treated Panx1flx/flx mice. (VEH/CTR n = 11, VEH/MS n = 13, TAMX/CTR n = 14, TAMX/MS n = 18, Panx1flx/flx/CTR n = 6, Panx1flx/flx/MS n = 7). Two-way repeated-measures ANOVA (significant effect of time (F5,315 = 236.9), treatment (F5,63 = 56.45), and interaction (F25,315 = 52.49)) and Sidak post-hoc test. (c) Assessment of daily morphine antinociception throughout the 7 d tolerance paradigm. Behavior was assessed using the thermal tail immersion test 30 min after injection of morphine (MS) or saline (CTR) and was normalized to daily baseline in Cx3cr1-CreERT2:Panx1flx/flx mice treated with vehicle (VEH/CTR n = 12, VEH/MS n = 17) or tamoxifen (TAMX/CTR n = 15, TAMX/MS n = 21), or Panx1flx/flx mice that received tamoxifen (Panx1flx/flx/CTR n = 6, Panx1flx/flx/MS n = 7). Two-way repeated-measures ANOVA (significant effect of time (F6,432 = 73.80), treatment (F5,72 = 109.5), and interaction (F30,432 = 16.67)) and Sidak post-hoc test. (d-e) Morphine dose-response curve, (d), and median effective dose (ED50), (e), in mice that received 7 d of morphine (MS) or saline (CTR). VEH/CTR n = 10, VEH/MS n = 14, TAMX/CTR n = 13, TAMX/MS n = 18, Panx1flx/flx/CTR n = 6, Panx1flx/flx/MS n = 7. One-way ANOVA (F5,62 = 9.15) and Sidak post-hoc test. In each panel, error bars represent s.e.m; each circle represents data from an individual animal. *P<0.05.

