Figure 3.
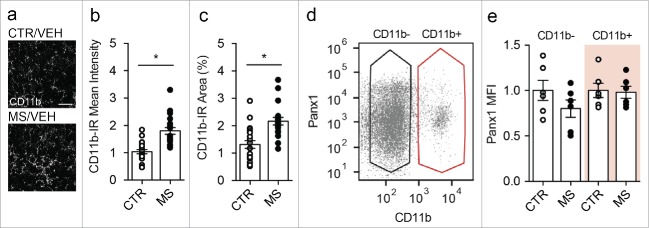
Morphine tolerant mice exhibit increased microglial reactivity, but no change in microglial Panx1 expression (a-e) Mice received daily morphine sulfate (MS, 10 mg per kg) or saline (CTR) for 7 d. (a) Representative images of CD11b immunoreactivity (IR) in spinal dorsal horn sections taken from CTR and MS mice. Scale bar = 25 μm. (b-c) Quantification of (b) mean intensity of CD11b-immunoreactivity (CD11b-IR) or (c) percent area of CD11b-IR in CTR (n = 21) and MS (n = 19) treated mice. N values indicate the number of sections analyzed. Two-tailed t-test (mean intensity, t = 5.38 df = 38; percent area, t = 4.28 df = 38). (d) Dot plot of flow cytometric analysis representing gating parameters used for CD11b negative (CD11b-, black) and CD11b positive (CD11b+, red) populations used to calculate mean fluorescent intensity (MFI) of Panx1 expression. (e) Quantification of Panx1 mean fluorescent intensity (MFI) in CD11b- or CD11b+ spinal cord cell populations obtained from saline (CTR) or morphine (MS) treated mice. MFI values from MS cells are normalized to respective CD11b- or CD11b+ control cells. N = 6 experimental replicates from 4 CTR and 4 MS animals. One-way ANOVA (F3,20 = 1.17, p = 0.35). In each panel, error bars represent s.e.m; each circle represents data from an individual experiment. *P<0.05.

