Figure 3.

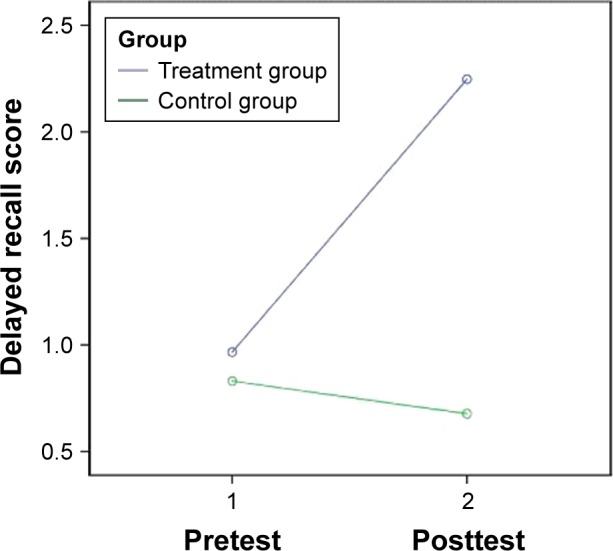
Change in delayed recall score of the treatment and the control groups.
Note: Covariates appearing in the model are evaluated at the following values: age =74.97, sex =0.13, education =2.18, marital status =3.26.

Change in delayed recall score of the treatment and the control groups.
Note: Covariates appearing in the model are evaluated at the following values: age =74.97, sex =0.13, education =2.18, marital status =3.26.