Figure 3.
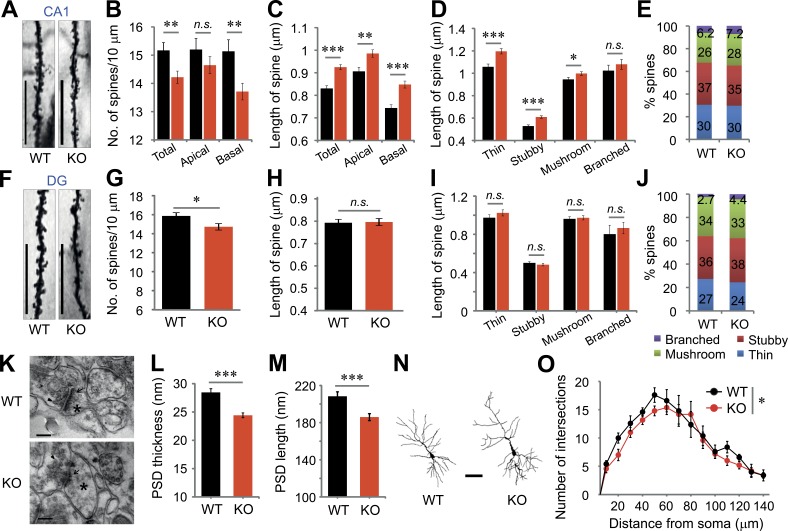
Alteration of synaptic structures in CA1 and DG regions of VRK3-KO mice. (A) Representative images of dendrites in CA1 pyramidal neurons of WT and VRK3-KO mice. Bars, 10 µm. (B) Quantification of spine density (spines per 10 µm) on apical and/or basal dendrites in the CA1 region (n = 44, 114 dendrites from 6, 8 mice of WT and VRK3-KO mice, respectively; **, P < 0.01, t test). (C) Quantification of spine length on apical and/or basal dendrites in the CA1 region (n = 665, 1,621 spines from 6, 8 mice; ***, P < 0.001; **, P < 0.01, t test). (D) Dendritic spines in the CA1 region were classified as thin, stubby, mushroom, or branched. Spine length for specific spine subtypes in the CA1 region (n = 88–574 spines from 6, 8 mice; ***, P < 0.001; *, P < 0.05, t test). (E) Comparable proportions of each type of spine on apical and basal dendrites in the CA1 region of WT and VRK3-KO mice (n = 6, 8 mice; P > 0.05, χ2 test). (F) Representative images of dendrites in the DG region of WT and VRK3-KO mice. Bars, 10 µm. (G) Quantification of spine density (spines per 10 µm) in the DG region (n = 37, 40 dendrites from four mice per genotype; t75 = 2.326, *, P < 0.05, t test). (H) Quantification of spine length in the DG region (P > 0.05, t test). (I) Spine length for specific spine subtypes in the DG region (P > 0.05, t test). (J) Comparable proportions of each type of spine in the DG region of WT and VRK3-KO mice (n = 4, 4 mice; P > 0.05, χ2 test). (K) Representative electron micrographs of hippocampal CA1 synapses showing the presence (magnification 120,000×) of PSD (arrows), synaptic vesicles (arrowheads), and dendritic spines (asterisks). Bars, 200 nm. (L) PSD length (n = 214, 321 synapses from 3, 3 mice; ***, P < 0.001, t test). (M) PSD thickness (n = 155, 236 synapses from 3, 3 mice; ***, P < 0.001, t test). (N) Reconstructions of representative neurons of Golgi-stained pyramidal neurons. Bar, 50 µm. (O) Number of intersections of the dendrite at different distances (radius) from the soma (center of analysis) from Sholl analysis (n = 5 neurons). A repeated-measures ANOVA indicates a statistical significance for genotype (F1,56 = 5.63, P = 0.02; *, P < 0.05), but not radius (distance) genotype, interaction (F1,56 = 0.61, P = 0.84). n.s., not significant. All values represent mean ± SEM.

