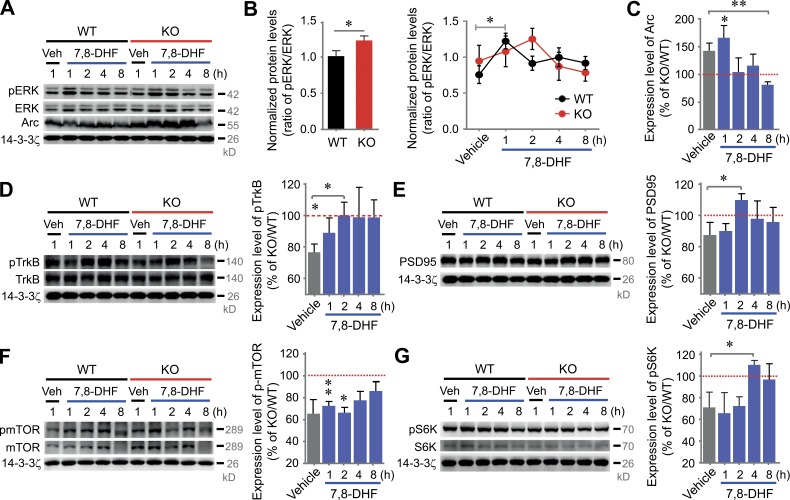
Figure 6.
TrkB stimulation restores dysregulated Arc-induced synaptic plasticity in VRK3-KO mice. (A–C) Representative Western blots (A) and quantitative plots of the time courses of 7,8-DHF–induced ERK (B) and Arc expression (C). Arc protein was normalized by 14-3-3ζ (B: n = 4/4/4/4/4 and n = 4/4/4/4/4 for vehicle/7,8-DHF(1hr)/7,8-DHF(2hr)/7,8-DHF(4hr)/7,8-DHF(8hr)-treated WT and VRK3-KO mice, respectively; *, P < 0.05, t test; C: n = 4/4/4/4/4 for WT and n = 4/4/4/4/4 for KO; **, P < 0.01; *, P < 0.05, t test; vehicle-treated VRK3 KO vs. 7,8-DHF [8 h]–treated VRK3 KO; **, P < 0.01, t test). (D–G) Representative Western blots and quantitative plots of the time course of 7,8-DHF–induced TrkB (D), PSD-95 (E), mTOR (F), and S6K (G) activation in VRK3-KO mice compared with vehicle-treated WT mice (D: n = 5/5/5/5/5 for WT and n = 5/5/5/5/5 for KO; WT vs. VRK3 KO; t8 = 2.577; *, P < 0.05, t test; vehicle-treated VRK3 KO vs. 7,8-DHF [2 h]–treated VRK3 KO t8 = 2.325; *, P < 0.05; E: n = 4/4/4/4/4 for WT and n = 4/4/4/4/4 for KO; P > 0.05, t test; vehicle-treated VRK3 KO vs. 7,8-DHF [2 h]–treated VRK3 KO; *, P < 0.05, t test; F: n = 4/4/4/4/4 for WT and n = 4/4/4/4/4 for KO; P = 0.11; **, P < 0.01; *, P < 0.05, t test; G: n = 4/4/4/4/4 for WT and n = 4/4/4/4/4 for KO; t6 = 1.538, P = 0.17, t test; vehicle-treated VRK3 KO vs. 7,8-DHF [4 h]–treated VRK3 KO; *, P < 0.05, t test). Each densitometry analysis of Western blots in KO mice was normalized by calculation of relative protein levels compared with corresponding values of the vehicle-treated (1 h) and 7,8-DHF–treated (1, 2, 4, and 8 h) WT control group after normalization to 14-3-3ζ levels. The same 14-3-3ζ loading control was used in both D and E, being the same test group. All values represent mean ± SEM.

