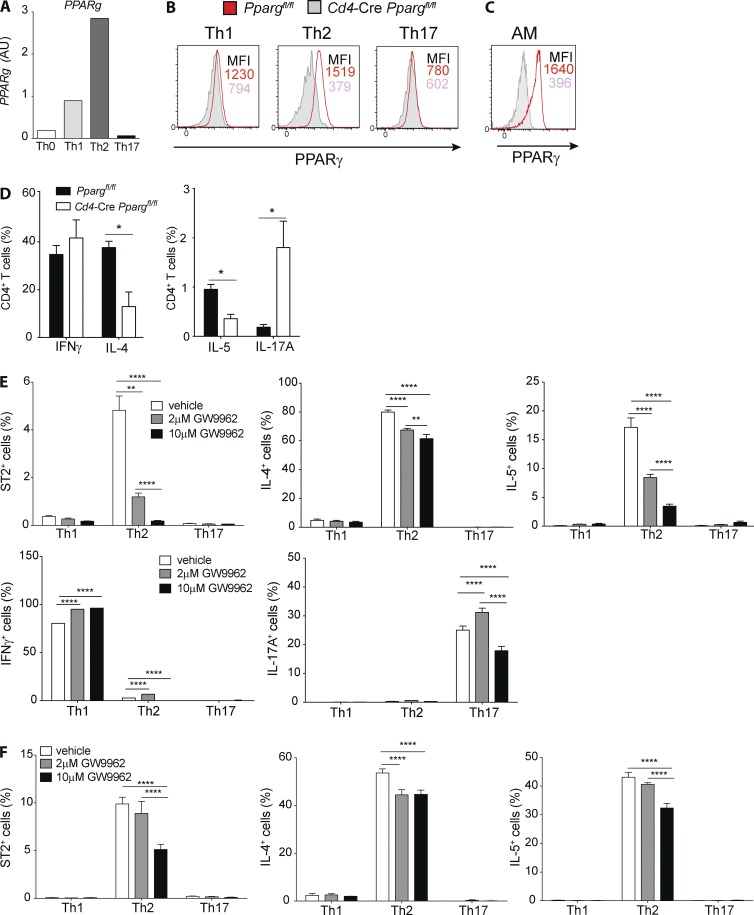
Figure 2.
PPARγ is highly expressed in mouse T cells and controls Th2 polarization in vitro. Naive splenic CD4+ T cells were sorted from Ppargfl/fl and Cd4-CrePpargfl/fl mice and were co-cultured for 4 d with splenic DCs and soluble αCD3 mAbs (2 µg/ml). Shown are the Pparg mRNA of Ppargfl/fl cells (WT; A) and the intracellular protein expression of PPARγ in Ppargfl/fl cells (B), with the corresponding Cd4-CrePpargfl/fl controls and PPARγ expression in AMs as a comparison (C). (D) Cytokine production profile after 4 h restimulation with PMA/ionomycin (n = 4/condition). (E and F) naive, splenic, Smarta-1, transgenic CD4+ T cells were co-cultured with splenic DCs and 10 nM gp61 peptide in polarizing conditions in the presence of PPARγ antagonist GW9662 at the indicated concentrations or in vehicle (DMSO) as a control. Shown are the frequencies of ST2+ and cytokine-producing cells of indicated cytokines after restimulation with PMA/ionomycin. (E) GW9662 was added from the beginning and cells were analyzed after 4 d of culture (n = 4/condition). (F) Cells were cultured for 4 d before addition of GW9662 and analyzed 24 h later (n = 4/condition). The data are representative of three independent experiments. Data are means ± SEM and the sample size (n). ANOVA (one-way) was used. *, P < 0.05; **, P < 0.01; ****, P < 0.0001.

