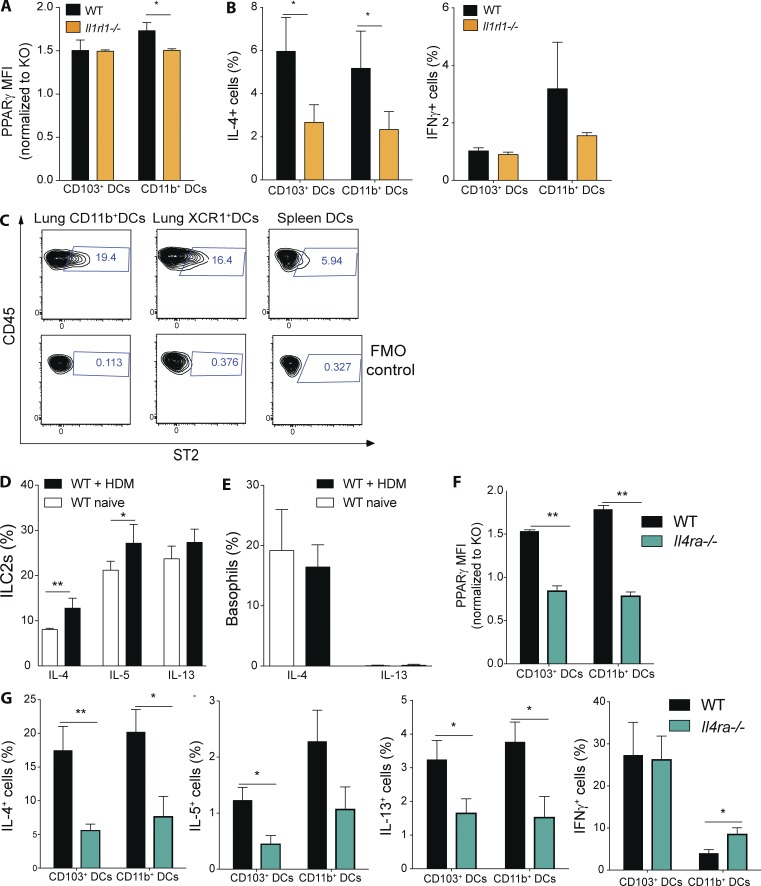
Figure 9.
IL-4 receptor and IL-33 receptor signaling controls PPARγ expression and DC-mediated Th2 polarization. (A) PPARγ expression in lung DCs from naive WT and Il1rl1−/− mice was measured using flow cytometry. Shown is the MFI of PPARγ normalized to the PPARγ-deficient control of the indicated DC subsets (n = 3/group). (B) Lung DCs from WT and Il1rl1−/− animals were isolated and co-cultured in vitro for 4 d with naive, splenic, Smarta-1, transgenic CD4+ T cells and 1 nM gp61 peptide. Frequency of IL-4+ and IFN-γ+ CD4+ T cells (n = 10/condition). (C) Surface expression of ST2 on WT lung and splenic DCs was evaluated using flow cytometry. Shown are representative FACS plots including fluorescence minus one (FMO) controls (n = 3/group). (D and E) WT animals received PBS or 100 µg HDM intratracheally and lungs were analyzed for cytokine-producing cells 18 h after infection. Shown is the frequency of cytokine-producing ILC2s (D) and basophils (E) of indicated cytokines (n = 4/group). (F) PPARγ expression in lung DCs from naive WT and Il4ra−/− mice was measured using flow cytometry. Shown is the MFI of PPARγ normalized to the PPARγ-deficient control of the indicated DC subsets (n = 3/group). (G) Lung DCs from WT and Il4ra−/− animals were isolated and co-cultured in vitro for 4 d with naive, splenic, Smarta-1, transgenic CD4+ T cells and 1 nM gp61 peptide. Shown are the frequencies of IL-4+, IL-5+, IL-13+, and IFN-γ+ CD4+ T cells (n = 8/condition) Data are means ± SEM and the sample size (n). ANOVA (one way) was used. *, P < 0.05; **, P < 0.01.

