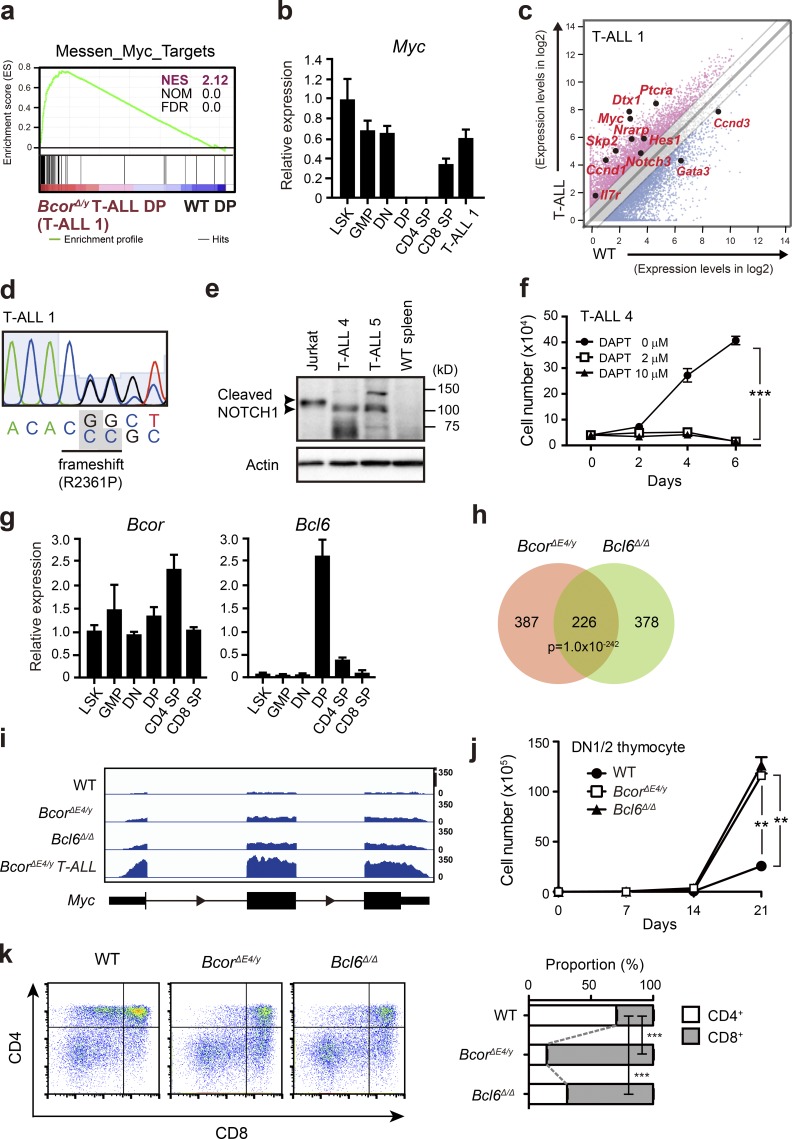
Figure 4.
Activation of Myc in BcorΔE4/y DP thymocytes and T-ALL. (a) GSEA plot for the MYC target gene set demonstrating significant positive enrichment in BcorΔE4/y DP T-ALL cells relative to WT DP thymocytes. NES, NOM, and FDR are indicated. Red and blue colors represent positive (up-regulated in the given genotype relative to WT) and negative (up-regulated in WT relative to the given genotype) enrichment, respectively. (b) Quantitative RT-PCR analysis of Myc in various hematopoietic cell fractions and BcorΔE4/y DP T-ALL cells. Hprt1 was used to normalize the amount of input RNA. Data are shown as the mean ± SD (n = 3). Representative data from two independent experiments are presented. (c) Scatter diagram showing RNA sequence data. Signal levels of RefSeq genes (RPKM+1 in log2) in BcorΔE4/y DP T-ALL cells and WT DP thymocytes are plotted. Light gray lines represent the boundaries for a twofold increase and twofold decrease. Representative direct target genes of NOTCH1 are shown as red dots. (d) Chromatogram traces showing a Notch1 mutation in exon 34 (T-ALL no. 1). The variant bases are listed underneath and indicated in gray boxes. (e) Cleaved NOTCH1 protein in T-ALL cells detected by Western blot analysis. Cleaved NOTCH1 proteins in human T-ALL cells (Jurkat) and BCORΔE4 T-ALL cells (CD8 SP and CD4 SP T-ALL cells from the spleens of T-ALL nos. 4 and 5, respectively) are indicated by arrowheads. Actin served as a loading control. Representative data from two independent experiments are presented. (f) In vitro proliferation of BcorΔE4/y T-ALL cells. CD8 SP T-ALL cells from the spleen of T-ALL no. 4 were cultured on TSt-4 stromal cells in the presence of a γ-secretase inhibitor DAPT. Data are presented as the mean ± SEM of triplicate cultures. Representative data from two independent experiments are presented. ***, P < 0.001 by Student’s t test. (g) Quantitative RT-PCR analysis of Bcor and Bcl6 in various hematopoietic cell fractions. Hprt1 was used to normalize the amount of input RNA. Data are shown as the mean ± SD (n = 3). Representative data from two independent experiments are presented. (h) Venn diagram of RefSeq genes up-regulated in DP thymocytes from BcorΔE4/y and Bcl6Δ/Δ mice 4 wk after the injection of tamoxifen (more than twofold relative to the WT control). The numbers of genes in each group are indicated. The overlap between the two gene sets is statistically significant (P < 1 × 10−242). (i) Snapshots of RNA sequence signals at the Myc gene locus in WT, BcorΔE4/y, and Bcl6Δ/Δ DP thymocytes and BcorΔE4/y DP T-ALL cells. The structure of the Myc gene locus is indicated at the bottom. (j) In vitro proliferation of BcorΔE4/y and Bcl6Δ/Δ thymocytes. DN1/2 thymocytes from BcorΔE4/y and Bcl6Δ/Δ mice were cultured on TSt-4/DLL stromal cells in the presence of 10 ng/ml SCF, Flt3L, and IL-7. Data are presented as the mean ± SEM of triplicate cultures. (k) In vitro differentiation of BcorΔE4/y and Bcl6Δ/Δ thymocytes. Culture conditions in j were switched to differentiation conditions by reducing the cytokine concentration to 2 ng/ml on day 14 of culture, and cells were cultured for a further 7 d. Differentiation was evaluated by flow cytometric analyses. Representative CD4 and CD8 expression profiles are depicted. The proportions of CD4+CD8+, CD4+CD8−, and CD4−CD8+ thymocytes are as follows: WT, 25.8 ± 1.0, 21.7 ± 0.6, and 9.1 ± 0.1; BcorΔE4/y, 17.1 ± 0.6, 4.1 ± 0.1, and 24.0 ± 0.2; and Bcl6Δ/Δ, 14.1 ± 0.8, 7.2 ± 0.2, and 16.3 ± 0.5, respectively (n = 3). The proportions of CD4 SP and CD8 SP thymocytes are shown at right. **, P < 0.01; ***, P < 0.001 by Student’s t test. Representative data from three independent experiments are presented (j and k).

