Figure 5.
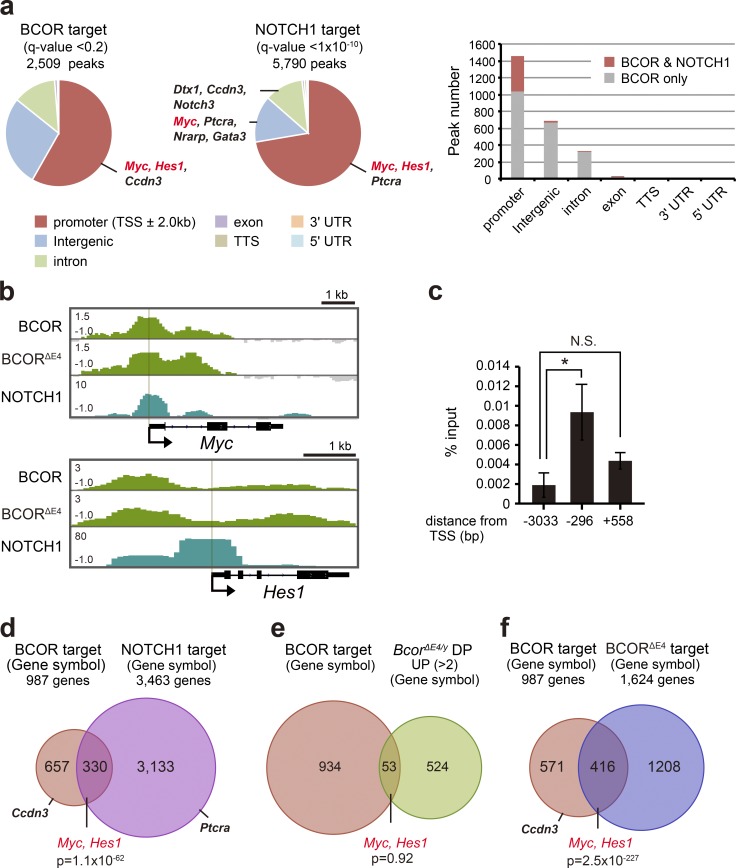
BCOR targets Myc and other NOTCH1 targets in DP thymocytes. (a) Distribution of ChIP-seq peaks of BCOR in thymocytes (q-value < 0.2) and NOTCH1 in T-ALL cells (data were retrieved from Yashiro-Ohtani et al., 2014; q-value < 10−10) in the indicated regions (left and middle, respectively). Representative NOTCH1 target genes are indicated. Number of BCOR peaks with and without NOTCH1 peaks in close proximity (±1.0 kb) are depicted at right. (b) Snapshots of the ChIP-seq signals of BCOR and BCORΔE4/y at the Myc and Hes1 gene loci in WT and BcorΔE4/y thymocytes, respectively, and those of NOTCH1 in T-ALL cells. The structures of Myc and Hes1 gene loci including relevant exons are indicated at the bottom of each related snapshot. (c) Manual ChIP assays for Bcor at the Myc locus using an anti-BCOR antibody. The relative amounts of immunoprecipitated DNA are depicted as a percentage of input DNA. Data are shown as the mean ± SD (n = 3). *, P < 0.05 by Student’s t test; N.S., not significant. (d) Venn diagram of BCOR target genes in DP thymocytes and NOTCH1 target in T-ALL cells (Yashiro-Ohtani et al., 2014) at the promoter region. The overlapping genes had BCOR and NOTCH1 peaks at their promoters in close proximity (≤1.0 kb). Representative NOTCH1 target genes are indicated. (e) Venn diagram of BCOR target genes at promoters and genes derepressed more than twofold in BcorΔE4/y DP thymocytes from WT DP thymocytes. Representative NOTCH1 target genes are indicated. (f) Venn diagram of the target genes of BCOR and BCORΔE4/y in WT and BcorΔE4/y thymocytes, respectively. Representative data from two independent experiments are presented (a–f).

