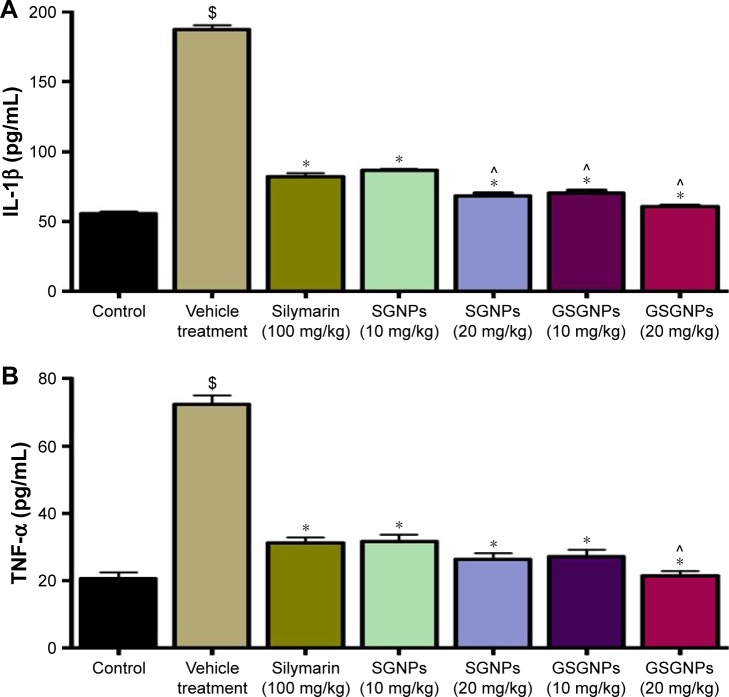
Figure 5.
Effect of various treatments on serum (A) IL-1β and (B) TNF-α levels. All the results are expressed as mean ± SD (n=6). $P<0.05, comparison of vehicle treatment with control; *P<0.05, comparison of silymarin, SGNPs, and GSGNPs treatment with vehicle treatment; ^P<0.05, comparison of SGNPs and GSGNPs treatment with silymarin treatment.
Abbreviations: IL-1β, interleukin-1β; TNF-α, tumor necrosis factor-α; SGNPs, silymarin-tethered gold nanoparticles; GSGNPs, SGNPs aggregated in glycogen.

