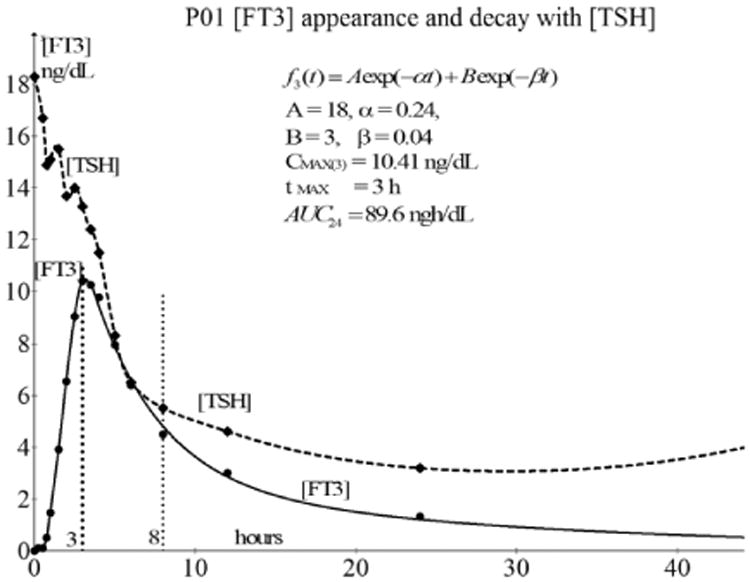
Fig. 12.

The decline in [TSH] (factor 10× magnified and dashed line) to a new equilibrium level at about 8 h after the oral dose of L-T3 compared with the [FT3] profile of P01. A similar behavior of [TSH] in combination with [FT3] profiles can be observed from the general overview of Fig. 1. The drop of [TSH] continues, even after the beginning of the decay at tmax = 3 h of [FT3], which is contrary to the feedback behavior, will be further discussed.
